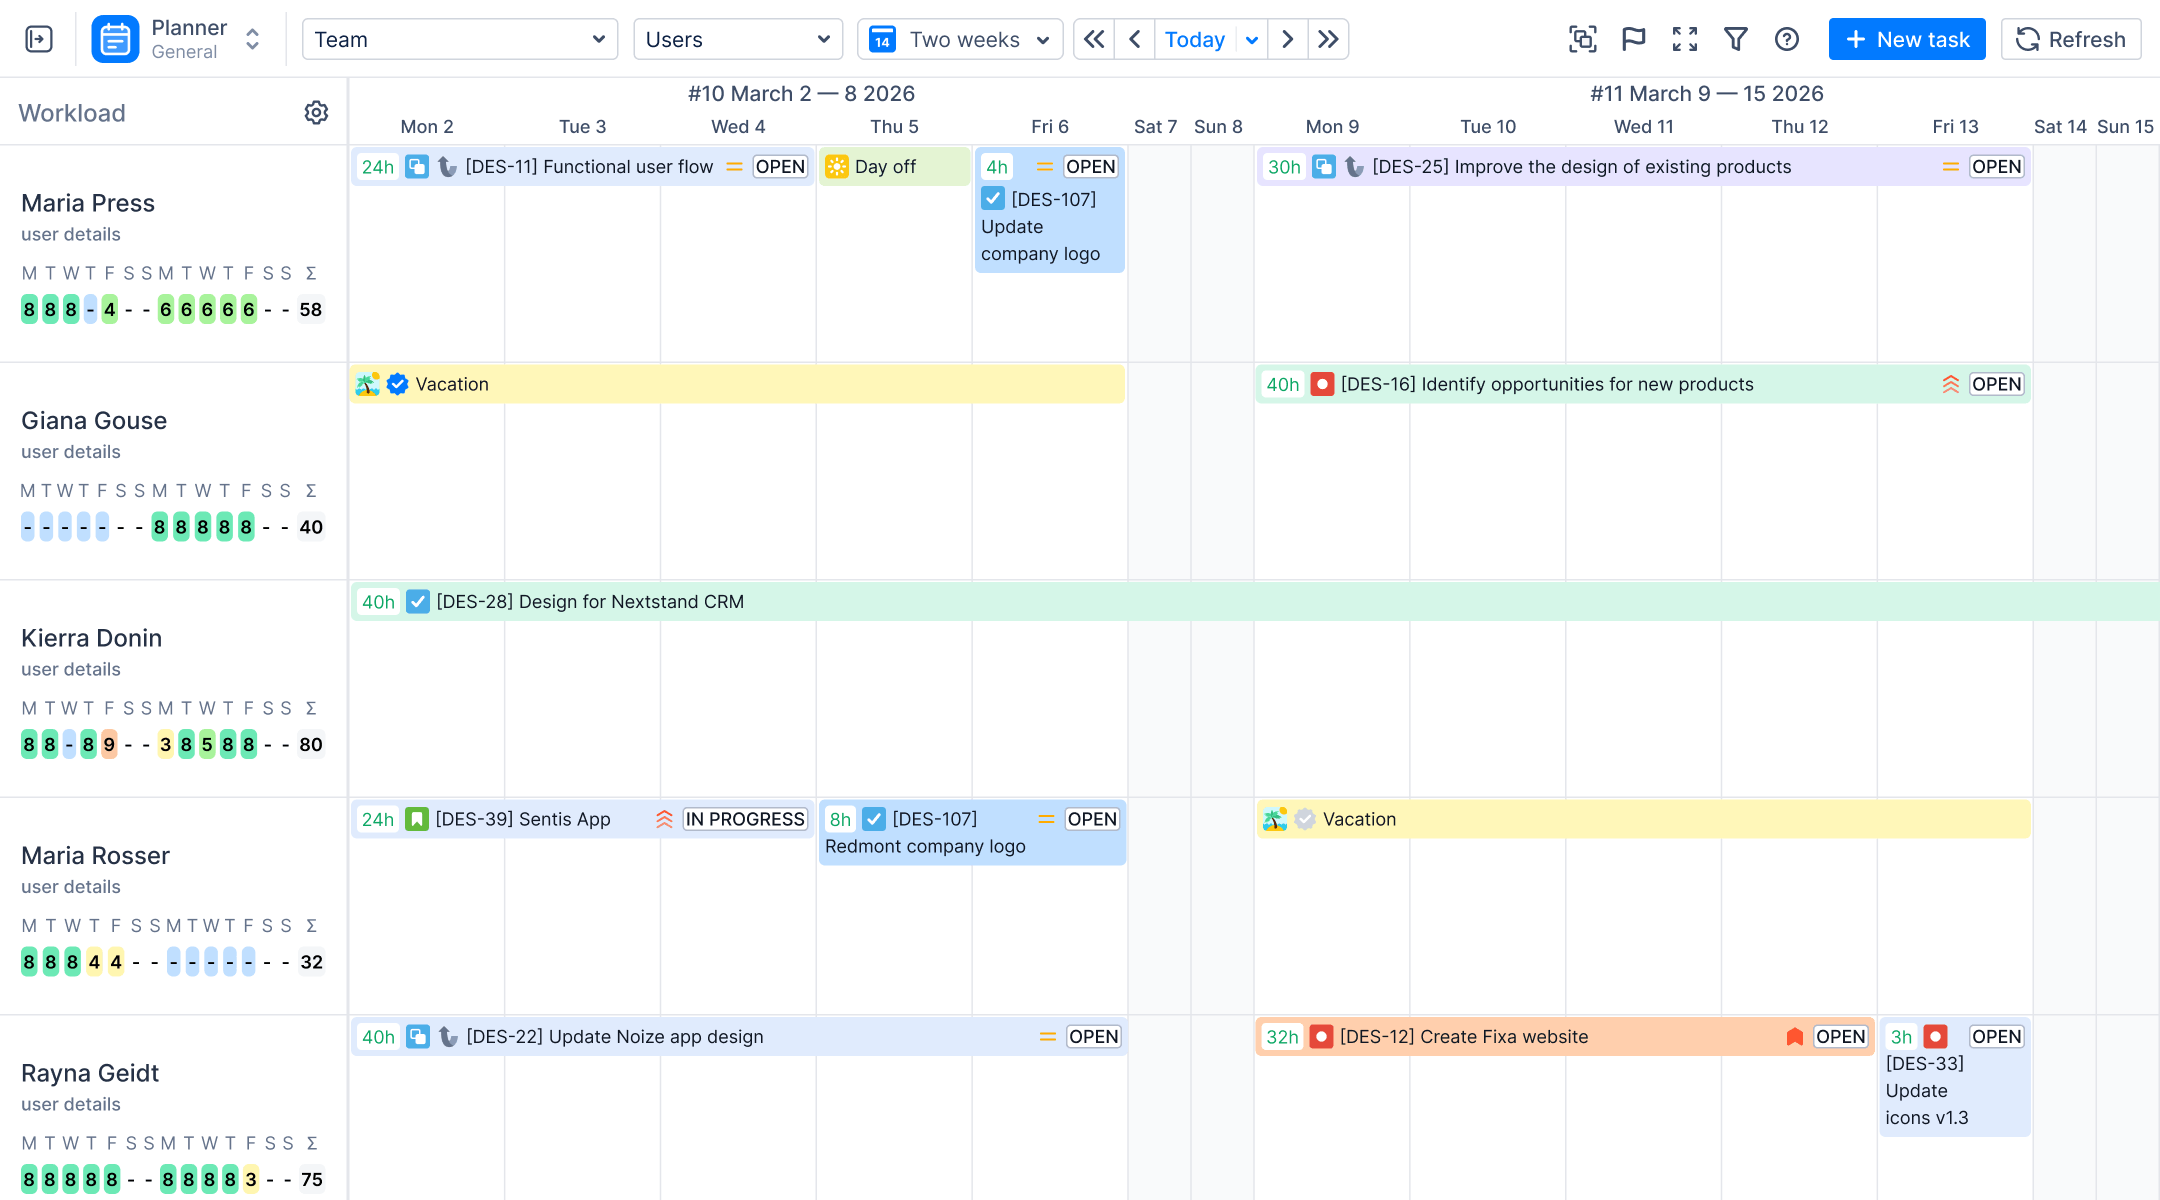
It’s sprint review. The capacity chart from planning day is all green, and nobody is over 100%. Yet the board still shows four work items in “In Review”, and the sprint ends today. If you’re a Scrum Master or project manager, you’ve probably been here.
Sprint capacity planning in Jira shows who has time, but not how long work waits between people. That waiting is usually where the missed days go. This article shows where those days go and how to plan around them, using Activity Timeline and Timepiece - Time in Status for Jira.
Key takeaways: Capacity planning tells you who has time. It doesn't tell you how long work waits. A 4-hour task can take 6 days to close and still look fine on the capacity chart. To hit your sprint deadline, track both: capacity in Activity Timeline, waiting time in Timepiece.
What Does Sprint Capacity Planning in Jira Actually Measure?
Most sprint plans go wrong before the sprint starts. Someone commits to more than they have time for, a holiday nobody counted takes out two days, and the team finds out halfway through. Capacity planning is how you catch this on planning day instead.
Capacity planning compares two numbers. Workload is the estimated work assigned to a team member. Capacity is the time that person has: their working hours minus vacation, sick leave and holidays. Add it up across a team, and you get team capacity, the ceiling for what a sprint can hold.
ActivityTimeline builds this from your Jira data:

- Workload comes from the remaining estimate on assigned work items, distributed across the dates they are scheduled.
- Work items can take those dates from the sprint, so they appear on each person's timeline for the sprint period.
- Under each person, a workload indicator shows whether they are overloaded, underloaded or balanced.
You can see who is overcommitted and move work before the sprint starts, not after someone falls behind. For the setup, see ActivityTimeline's guides to capacity planning in Jira and Jira sprint planning.
The Team Capacity Chart adds the team together: total capacity, utilized capacity, remaining capacity and utilization rate for the period you choose. Remaining capacity tells you how much room is left when unplanned work comes in, so you can say yes or no based on the numbers.

The developer booked at 130% and the sprint that coincides with a team holiday are two examples of how Jira sprint capacity planning detects issues early. Each one you catch on planning day is a deadline you don't have to explain later.
Green Workloads, Red Sprint: Where Does the Plan Break?
Here is an example story from a sprint. It had a 4-hour estimate and was scheduled on the developer's timeline in ActivityTimeline. The team logged 4 hours on it. Yet it still took 6 working days to close. (The numbers are an illustration.)
The estimate was right: 4 hours planned, 4 hours logged. But To Do, In Review and Waiting for QA took 4.5 of the 6 days, and most of that was waiting.
The capacity plan didn't get anything wrong. Activity Timeline calculates workload from each work item's remaining estimate and scheduled dates. A status change on its own changes neither, so the story added the same planned hours while it waited in review as while someone worked on it. Nobody's workload indicator turned red.
That is the difference between effort and elapsed time. Effort is the hours of work: 4. Elapsed time is the calendar time from start to done, waiting included: 6 days. Capacity planning measures effort. Your sprint deadline runs on elapsed time.
Where Does the Time Go Between Statuses?
Short answer: into waiting. Every work item's time splits into two parts:
Touch time: Someone is working on it.
Wait time: It sits in a status, and nobody is working on it.
A capacity plan counts estimated hours of work, which is roughly touch time. Wait time uses no one's hours, so it never shows up in the plan. But it still takes days off the calendar.
Flow efficiency shows how much of the total time was touch time: touch time divided by total time. In the story above, the team logged 4 hours over 6 working days (six 8-hour days, 48 working hours). If you treat logged time as touch time, that's a flow efficiency of about 8%. For the other 92% of the time, the story was waiting. In a case like this, cutting the waiting saves more days than working faster ever could.
Waiting tends to collect in a few places:
- Code review: The code is written, but the reviewer is busy with other work.
- Handoff to QA: The work item is ready for testing, but sits in "Ready for QA" until a tester is free.
- Approvals: The work item can't move until a manager, security team or client signs off.
- Another team: The work item depends on something another team has to deliver first.
- Rework: QA finds a problem and sends the work item back, so it goes through the same queues again.
Each of these is a workflow bottleneck. Atlassian describes a bottleneck as any point in a workflow where capacity is limited, so work piles up behind it. To find yours, you need to know how long work spent in each status.
How Do You Find Workflow Bottlenecks With Timepiece?
Most teams already have a guess about where work gets stuck. "Reviews are slow." "QA is always behind." The hard part is proving it, and knowing how many days it costs.
The good news is that Jira records every status change with a timestamp. But it shows that history one work item at a time. On company-managed spaces, the control chart plots the time work items spent in the statuses you select, with an average and standard deviation. That tells you work is slow. However, it doesn't show every status side by side, or who held the work. So the retro runs on memory, and the fix depends on who argues best.
Timepiece - Time in Status for Jira by OBSS turns that history into reports. It reads the status changes Jira already stores, so it covers past sprints as soon as you install it, and nobody has to log anything. Here is what it answers:
Which Status Eats the Sprint?
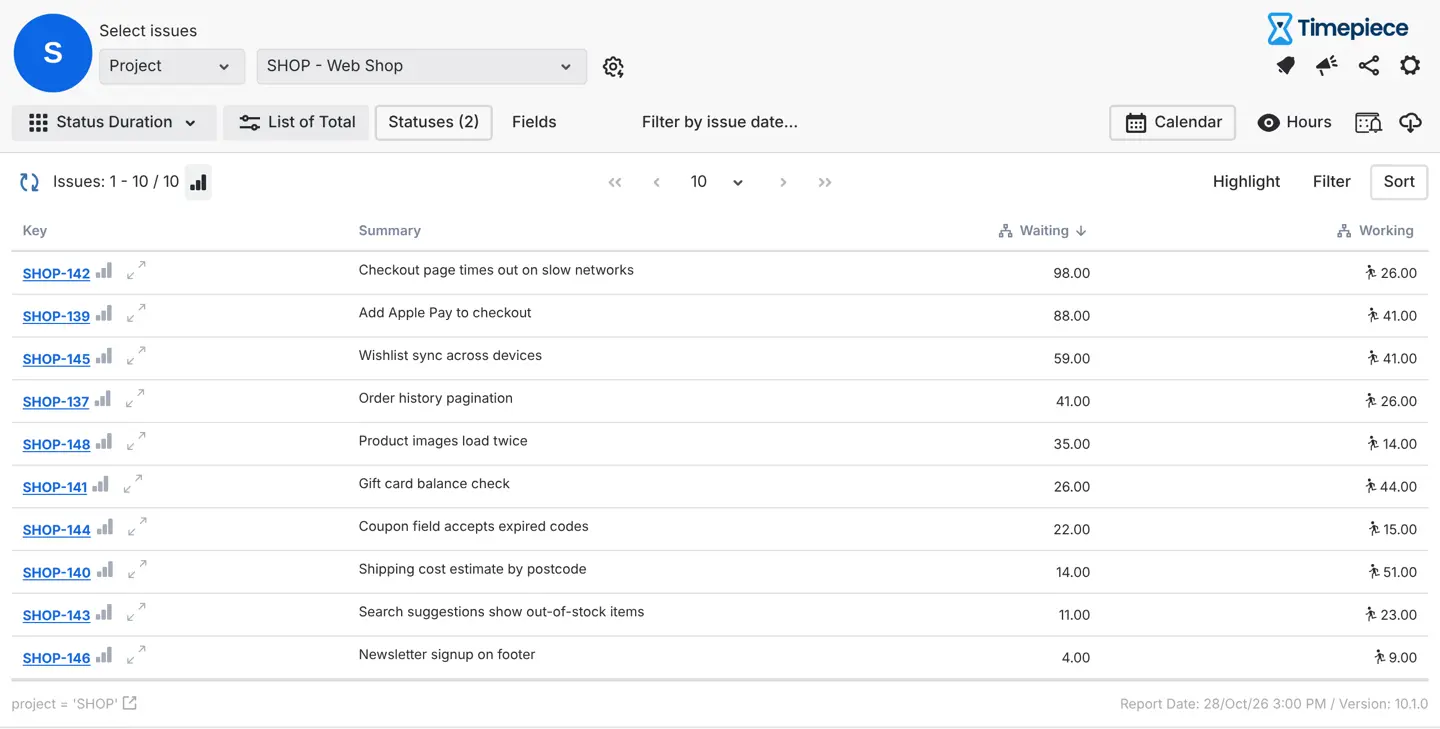
The Status Duration report shows the time each work item spent in each status. Use consolidated columns to group statuses into waiting and working (which ones count as waiting depends on your workflow), then sort by the waiting column. Your retro can start from a number, not a feeling.
Is It a Pattern or a Bad Week?
The Average report groups results by sprint, month or another field, such as issue type. If In Review is slow every sprint, it's worth fixing. If it spiked once, it probably isn't.
Who Did the Work Wait With?
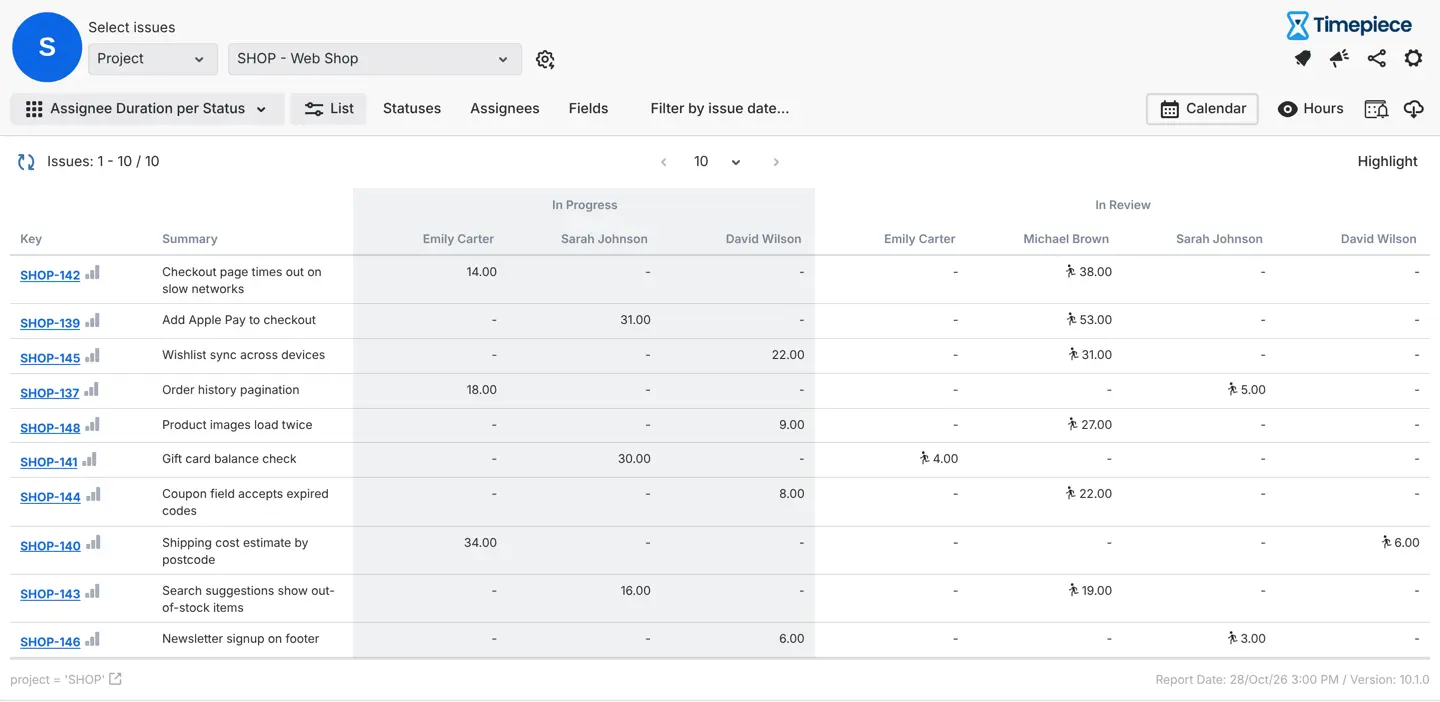
Assignee Duration per Status shows time per person in each status, and Group Duration does the same for user groups, such as developers or testers. If most "In Review" time sits with one reviewer, that points to workload, not to a slow person. The data keeps the conversation about the process, not about blame.
Are the Numbers Fair?
A custom calendar excludes weekends, holidays and non-working hours. Without it, work handed over on Friday evening looks like a weekend-long delay, and the team stops trusting the report. OBSS's guide to excluding non-working hours shows the setup.
How Often Does Work Bounce Back?
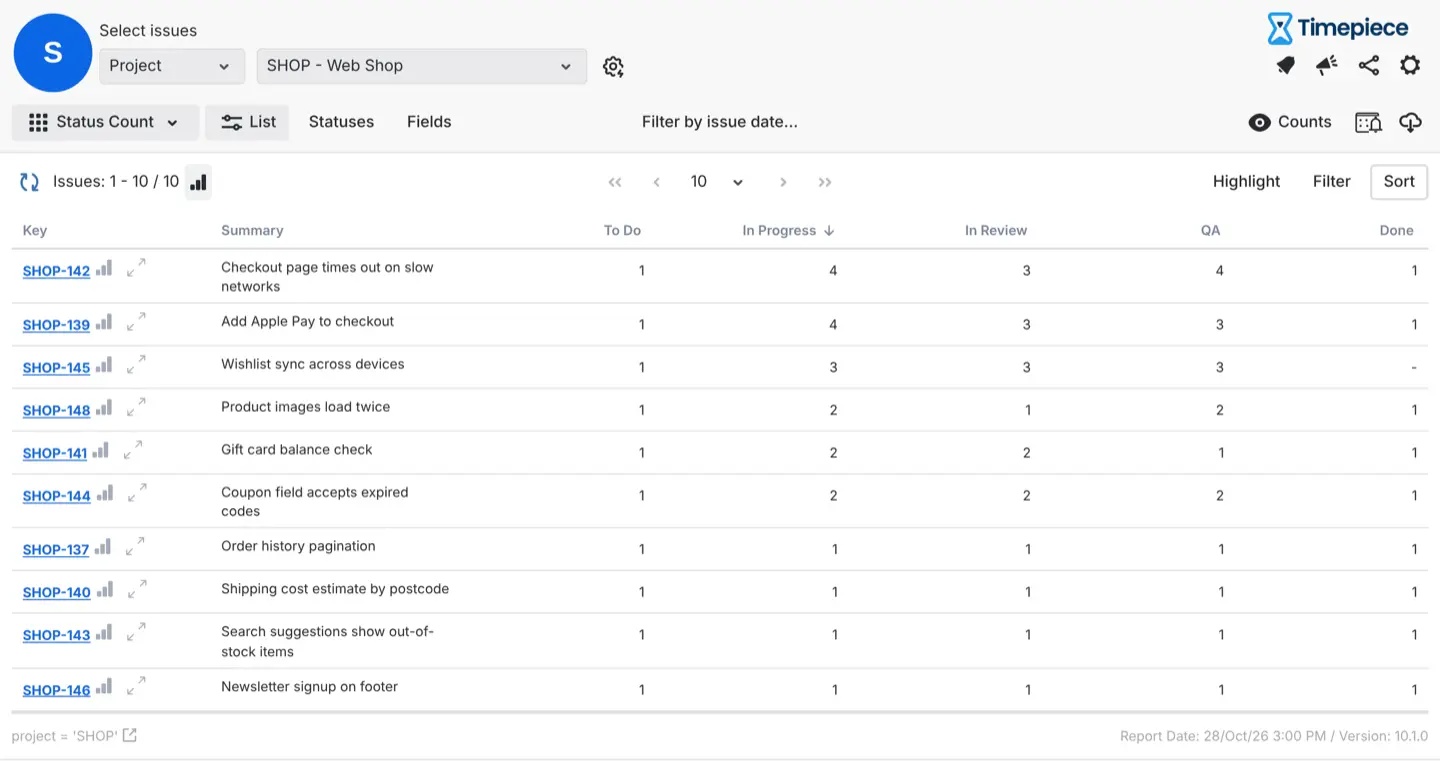
The Status Count report shows how many times each work item entered each status, so loops like QA back to In Progress stand out.
And you don't have to wait for the retro. Highlight rules color work items whose Cycle Time passes a threshold you set, and alarms send an email, Slack or Microsoft Teams message when a threshold is breached. You can unblock work while there is still time left in the sprint.
What Do You Get From Using Both Apps?
Timepiece shows where work waits. It doesn't show whether the people at that step have time. Activity Timeline does. Read them together, and you can tell which fix you need:
- The reviewer shows as overloaded in Activity Timeline: It's a capacity problem. Move work to someone with room, or plan review time into the next sprint.
- The reviewer has room, and work still waits: It's a process problem. Look at the handoff: how reviews are requested, who picks them up, and when.
That's the value of reading both: you put effort into the fix that matches the cause, not the one that sounds right in the retro.
Sprint Capacity Planning Plus Flow: A Workflow That Holds Up
Use the two views as a loop:
- Plan sprint capacity in Activity Timeline as usual. Check workload indicators and the Team Capacity Chart, and account for time off.
- During the sprint, watch time in status in Timepiece. Unblock work that waits longer than usual.
- After the sprint, compare planned and actual hours in Activity Timeline's Planned vs Actual Chart. It compares scheduled time with logged time, so it tells you whether your estimates were right, not whether work moved fast.
- Feed what you learned into the next plan. For example, reserve review time for the people who review most.
One trade-off: for a small team with one shared board, a daily look at the board may tell you the same thing. The two-tool setup pays off once several projects share the same people, because queues are harder to see by eye.
Which Metrics Should You Read Together?
One number on its own rarely tells you what went wrong. Put one view from each app side by side, and the reason a sprint slipped usually becomes a lot clearer.
The numbers show you where to look. Your team can tell you why it happened.
Find Out Where Your Sprint's Days Went
A green capacity chart means your team had the time. It doesn't mean the work moved. When a sprint slips and nobody was overloaded, the missing days are usually in a queue: waiting for review, for QA, or for sign-off.
Capacity shows effort, flow shows time, and your deadline lives in the calendar.
Want to see where your own sprint's days went? Both apps have a free trial on the Atlassian Marketplace:
- Try Activity Timeline to plan sprint capacity around real availability.
- Try Timepiece - Time in Status for Jira to see how long work waits in each status.
Not sure if your queue is a people problem or a process problem? Read the companion article on the OBSS blog.