{{tl-dr}}
A modern dashboard is the command center of any successful team. It’s where data, status updates, and key metrics converge to give you a clear picture of project progress and team performance. However, relying on default Jira dashboard gadgets often means key insights—especially around resource planning and time tracking—are siloed in separate tools.
ActivityTimeline closes this gap, empowering teams to bring rich, specialized data right into the native Jira dashboard. ActivityTimeline gadgets can be linked with other Atlassian tools or external systems, and may require server or jira instance configuration for secure integration. The value and difference ActivityTimeline brings compared to default gadgets is significant; for example, it allows managers to visualize resource allocation across multiple projects in real time, which is not possible with standard gadgets.
Enabling these integrations empowers teams to work more efficiently by centralizing information and streamlining workflows. This feature enhances your existing dashboard by embedding highly visual and customizable ActivityTimeline reports and charts, providing a unified and intelligent overview of your entire operation in a single, accessible location.
Introduction to Jira Dashboards
Jira dashboards are essential tools for teams looking to visualize and manage their work efficiently. At the heart of every Jira dashboard are dashboard gadgets—customizable components that display summaries, charts, and key data from your projects. These gadgets transform your Jira dashboard into a central hub where you can monitor project progress, track tasks, and access real-time project management insights. By leveraging dashboard gadgets, teams can easily display relevant data, keep everyone aligned, and ensure that project goals are always in focus. Whether you’re managing multiple projects or tracking a single team’s progress, Jira dashboards provide the flexibility and transparency needed to drive success.
Understanding Jira Gadgets
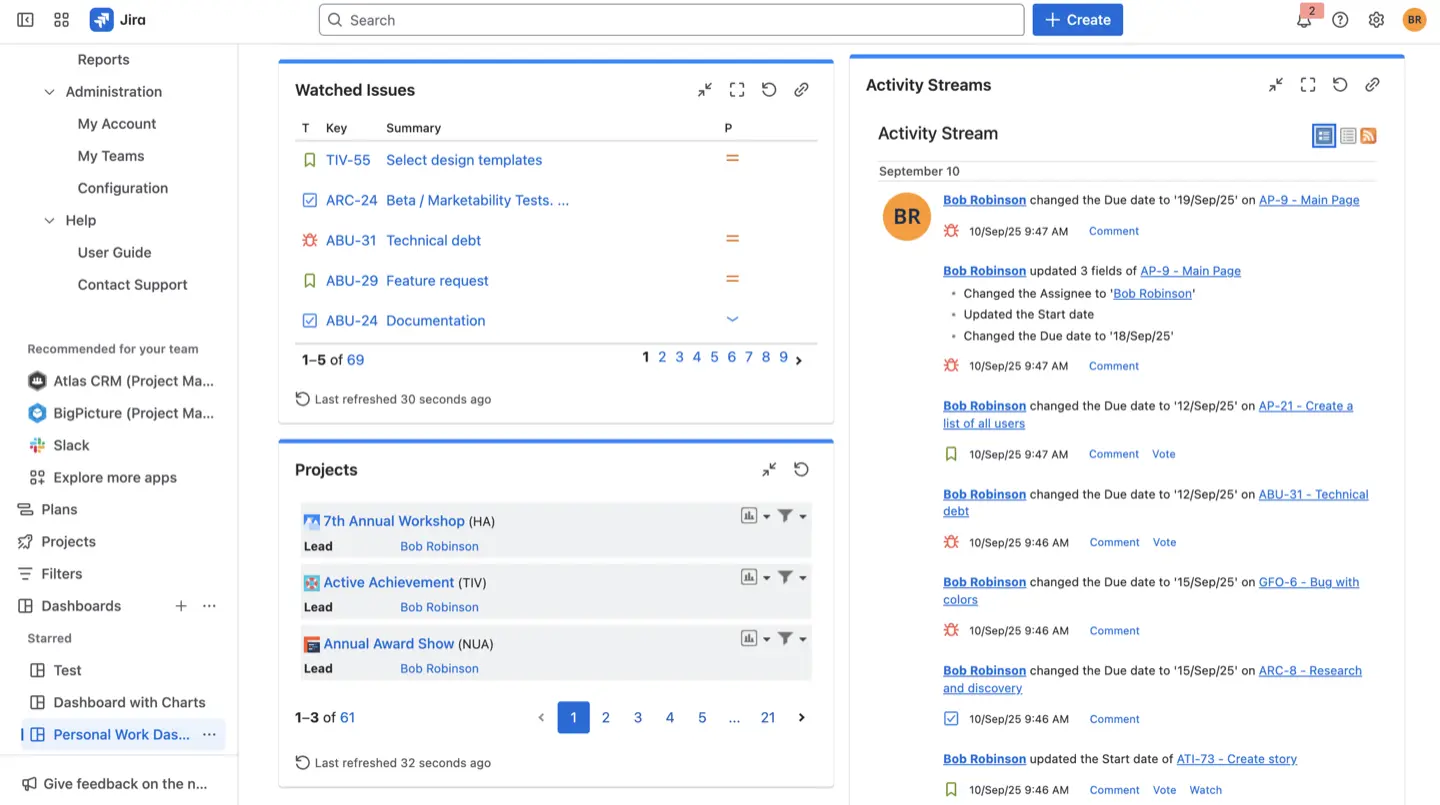
Jira gadgets are powerful widgets that you can add to your Jira dashboard to display specific types of project data. These gadgets help users visualize project progress, monitor assigned tasks, and analyze key metrics directly from the dashboard. Out-of-the-box, Jira offers a set of standard gadgets, such as activity streams and various charts, which can be immediately added to any dashboard.
For teams with unique requirements, custom gadgets can be created or installed from the Atlassian Marketplace, allowing you to display specialized data and extend your dashboard’s functionality. By configuring and combining different gadgets, users can create dashboards that provide actionable insights and help track project performance at a glance.
{{rich-cta-1}}
Types of Jira Gadgets
Jira offers a wide variety of gadgets to support different project management needs. Chart gadgets, such as pie charts, bar charts, and line charts, visually display project data, making it easy to track progress and identify trends over time. Filter results gadgets allow users to display issues that match specific criteria, helping teams focus on the most relevant tasks. Introduction gadgets can be used to display custom messages or instructions on the dashboard, improving communication.
Other useful gadgets include the average age gadget, which shows the average age of unresolved issues, and sprint burndown gadgets that help teams monitor remaining work in a sprint. By mixing and matching these gadgets, users can create a customized dashboard that highlights the most important data for their projects and teams.
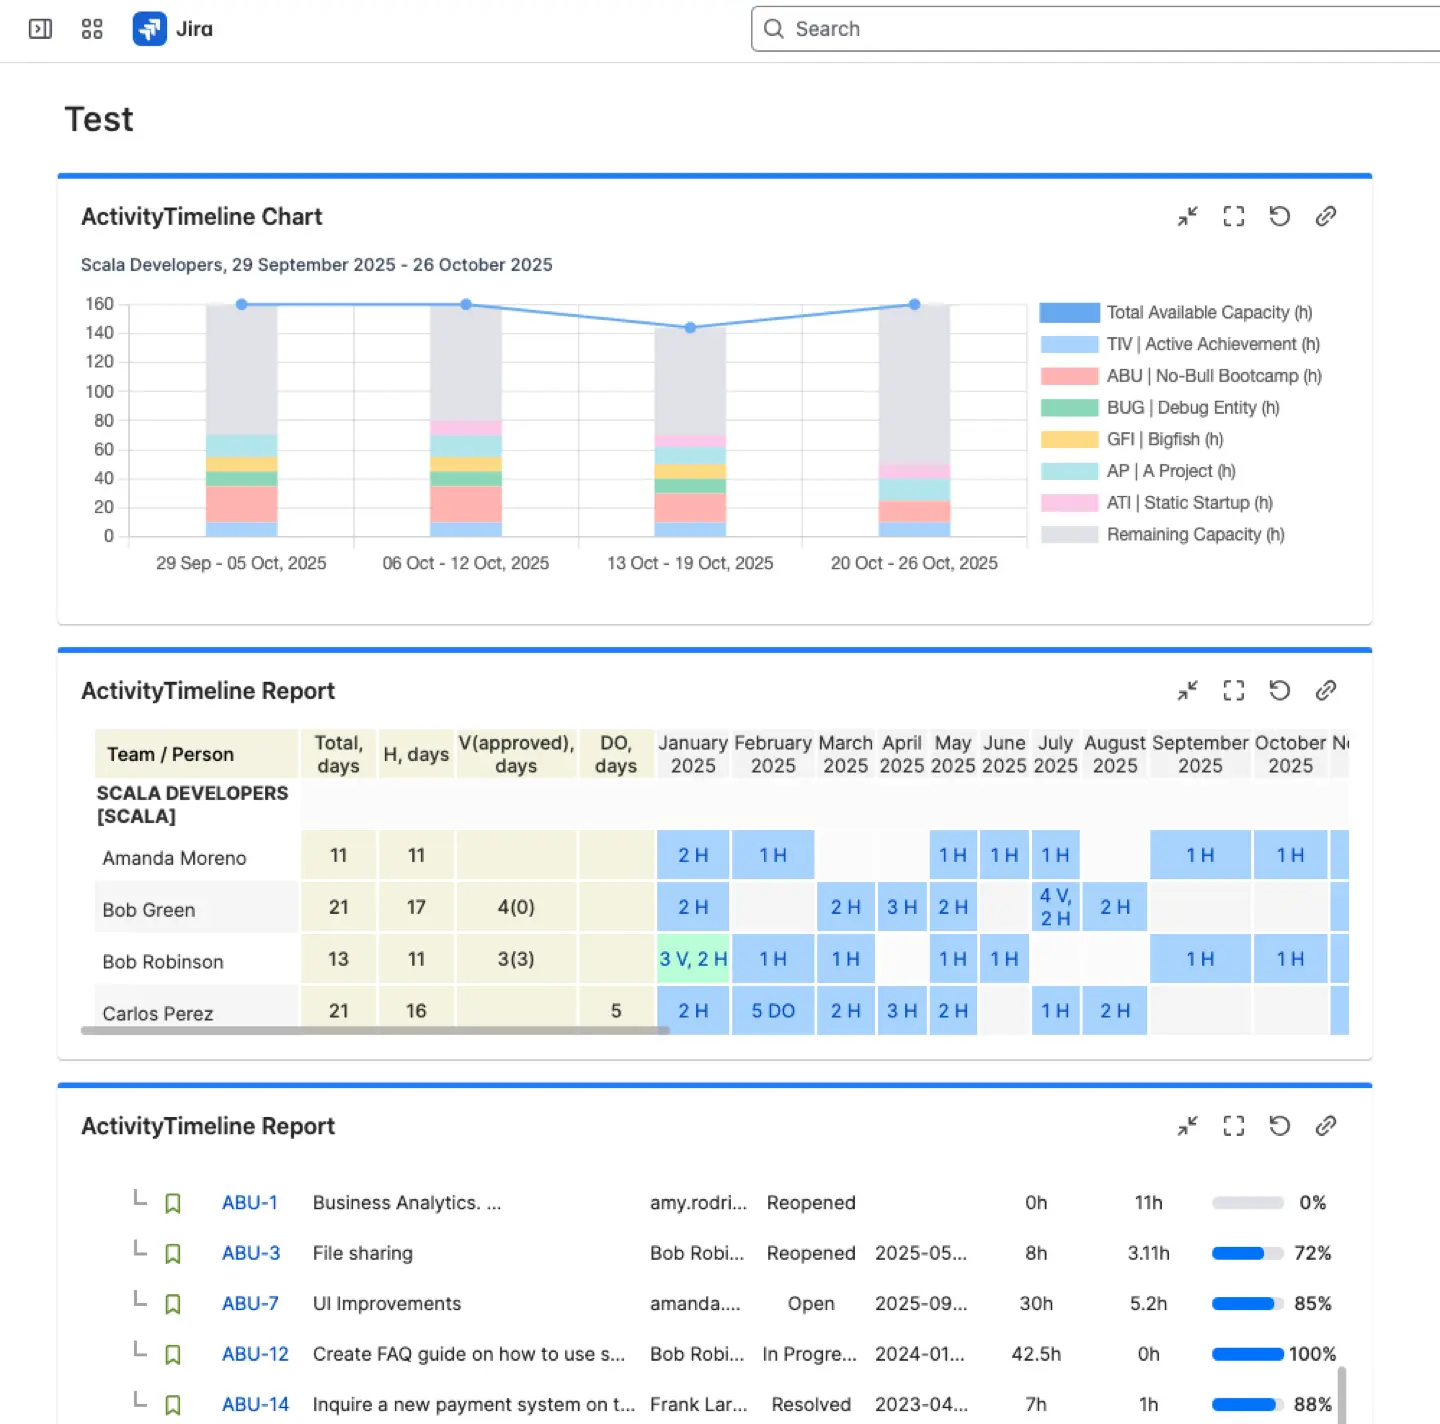
As for ActivityTimeline app, you can choose the report you want to see as a gadget and add it using our widgets.
How to Add Gadgets to Your Jira Dashboard
The process for adding gadgets from ActivityTimeline is designed to be as straightforward as using native Jira tools. Whether you’re using Jira Cloud or Data Center, the steps are the same:
- Navigate to Your Dashboard: First, navigate to your Jira dashboard of choice.
- Access the Edit Function: On the top-right corner of the dashboard, you will find an “Edit” button. Click it to enter the customization mode.
- Add a Gadget: A menu will appear on the right side of the screen. Click “add a gadget” to open a list of available widgets. You can browse the available gadgets before selecting the one you want to add.
- Find ActivityTimeline Gadgets: In the list, you can search for and select the ActivityTimeline Report or ActivityTimeline Chart gadget.
- Configure and Save: A configuration screen will prompt you to choose a specific report or chart to display. You can set the time period, units, and other filters before saving it to your dashboard. From this configuration screen, you can also generate reports or charts directly, allowing for real-time updates and efficient dashboard reporting.
This simple, step-by-step process ensures you can have your specialized report or chart up and running in just a few minutes. For troubleshooting or advanced configuration, refer to the available documentation for your Jira environment.
Customization and Real-time Insights
Once an ActivityTimeline report is on your Jira dashboard, it’s far from static. The true power of this integration is the ability to customize each gadget to suit your specific needs and maintain a real-time pulse on your projects.
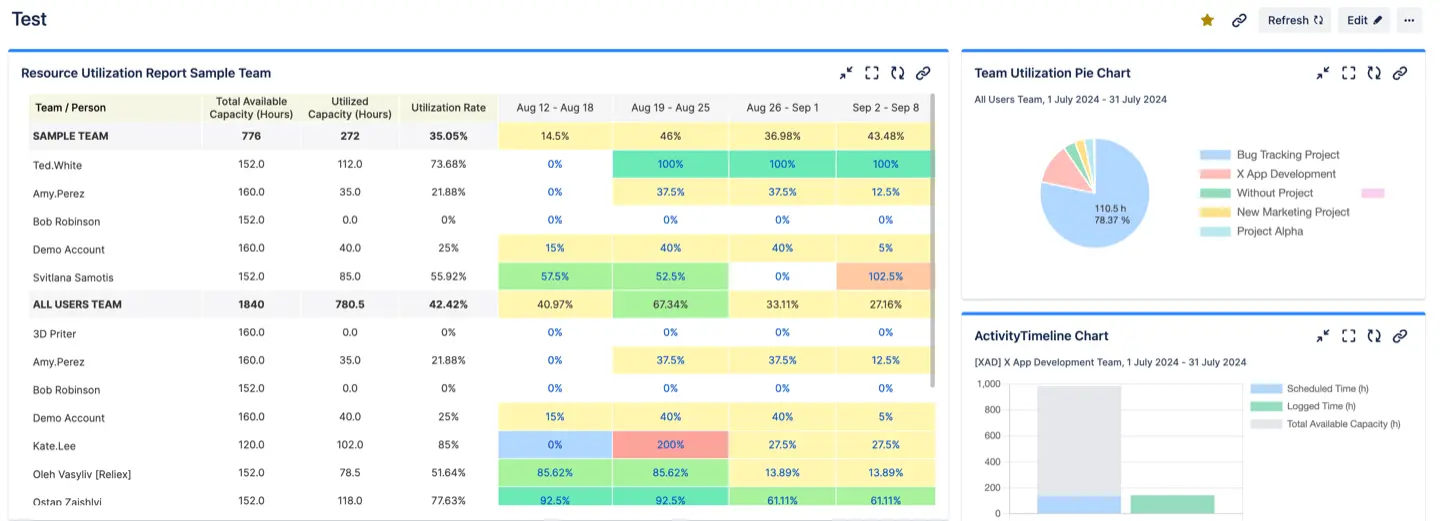
- Tailor the View: You can configure each gadget to display the exact data you need. For instance, you can select custom fields, a date field, and a statistic type when configuring a gadget. You can also choose to visualize data as a bar chart, line chart, or table—these gadgets display and summarize key values and provide a clear summary of your data. Gadgets can display links to detailed issue lists or related pages, and you can configure a message to communicate important information to the user. Additionally, versions, average time, created vs resolved, and issue statistics can be displayed using these tools for deeper insights into jira issues and all the issues in a project. These tools add value for the user, and configuring them properly ensures accurate and actionable data.
- Automatic Refresh: To ensure the information is always up-to-date, the gadgets refresh with the same frequency as all the gadgets on the dashboard. This refresh frequency can be manually set within the dashboard’s configuration.
- On-Demand Data: For immediate updates, simply click the refresh button on each gadget to get real-time data.
This combination of customization and real-time data ensures that your Jira dashboard remains a single source of truth for all your crucial metrics.
Best Practices for Jira Dashboards
To maximize the effectiveness of your Jira dashboards, it’s important to follow best practices when creating and configuring dashboard gadgets.
- Start by defining a clear purpose for your dashboard and identifying the target audience, whether it’s a project team, management, or stakeholders.
- Select the most relevant gadgets that align with your project goals and ensure the dashboard layout is organized and easy to navigate.
- Make use of customization options to tailor gadgets to your team’s needs, and regularly update the dashboard to keep data current and actionable.
By following these best practices, you can create Jira dashboards that provide relevant insights, enhance collaboration, and support better project management outcomes.
Conclusion
Integrating ActivityTimeline Reports as Jira Gadgets transforms a basic dashboard into an intelligent command center for project management. It provides a holistic, consolidated view of your team’s performance by bringing rich resource planning and time-tracking data directly into Jira's native interface. This streamlined access to specialized analytics enhances decision-making and allows you to proactively monitor project progress, ultimately driving greater efficiency and successful project outcomes.
{{rich-cta-3}}