

- Resource utilization measures your team's efficiency by comparing assigned work to their actual free time.
- Standard Jira reports are okay for basic capacity planning, but many teams end up struggling with limited features.
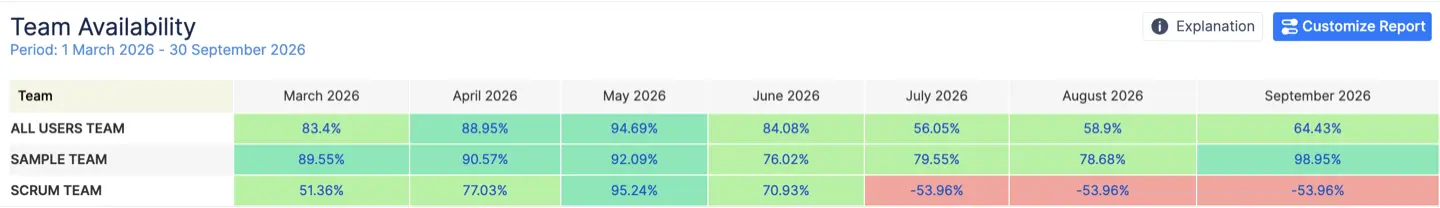
- ActivityTimeline provides advanced forecasting, real-time availability, and cross-project views.
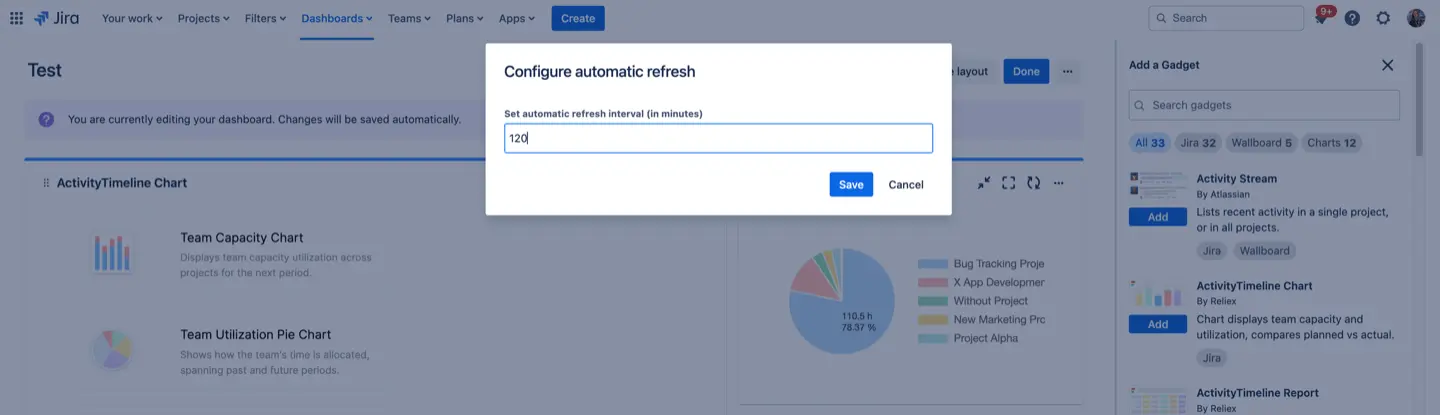
- Jira gadgets allow you to see utilization charts directly on your project dashboard without switching tools.
- Better visibility helps managers spot overbooked teams quickly to prevent burnout and redistribute tasks.
It doesn't matter how big or small your organization is, managing resources is essential of any project. A utilization report is a great way to track team performance and find areas for improvement.
Resource utilization is a vital metric for your business because it shows how effectively your team works. Every experienced PM constantly asks the following questions: “Are we wasting resources? Is our equipment running efficiently? Are we making the best use of each employee's time?” A well-structured utilization report provides the clear answers needed to solve these problems.
While tracking these details can feel overwhelming, Jira makes the process much easier. Read this guide to learn how to master resource workload management and get the most out of Jira reporting.
What is Utilization Report?
Resource utilization is how an organization uses its available human and non-human resources (e.g. staff, materials, machines, etc.) to produce products and services. The term resource utilization is a broad concept that includes efficiency, effectiveness, and capacity. A utilization report is a visual representation of this data for efficient Jira resource management.
Proper utilization actually helps a business grow. It measures how well a company uses its assets, including people, to generate revenue and make a profit.
To manage utilization, you need to track two things: workload (assigned work) and availability (free time). You cannot balance your team without measuring both. You can use reports like the Jira User Workload Report and the Utilization Report to gather these insights and monitor your team effectively.
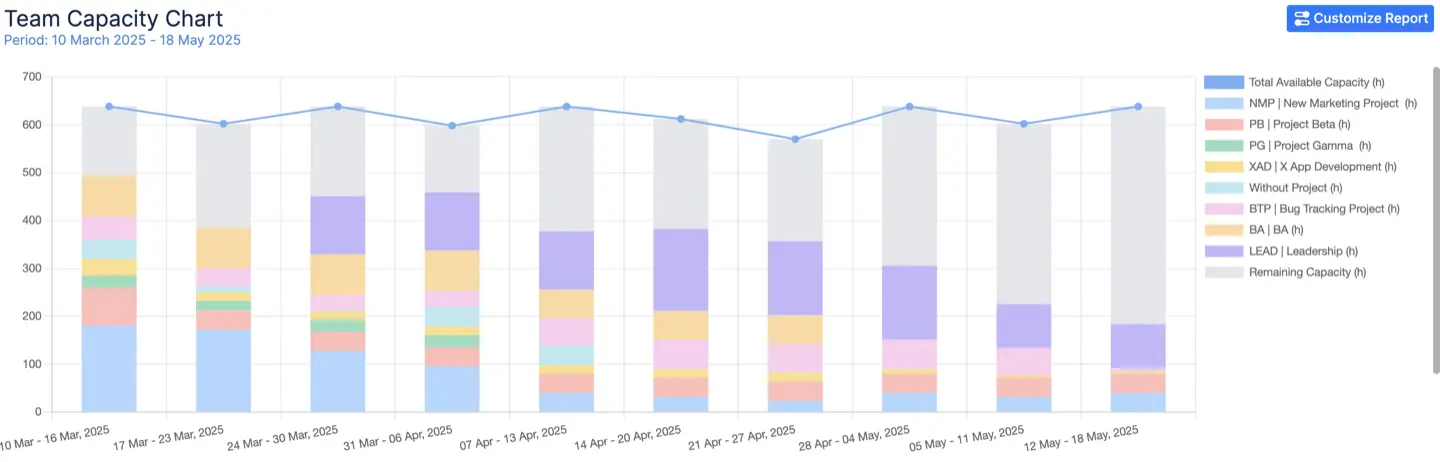
Resource Utilization Report in Jira
When managing tons of projects and teams, you need clear data to measure overall performance. The key to success is not just about collecting the data but also about analyzing it for better insights and metrics.
Teams use Jira to streamline their workflow, collaborate better and reduce time spent on repetitive tasks. Jira project dashboards are designed to provide a clear overview of the project at a glance. However, it is easy to miss important details about resource utilization. Since there is no one-size-fits-all approach, Jira allows you to choose from various reporting methods, including built-in tools or add ons.
Employee Utilization Reporting Role
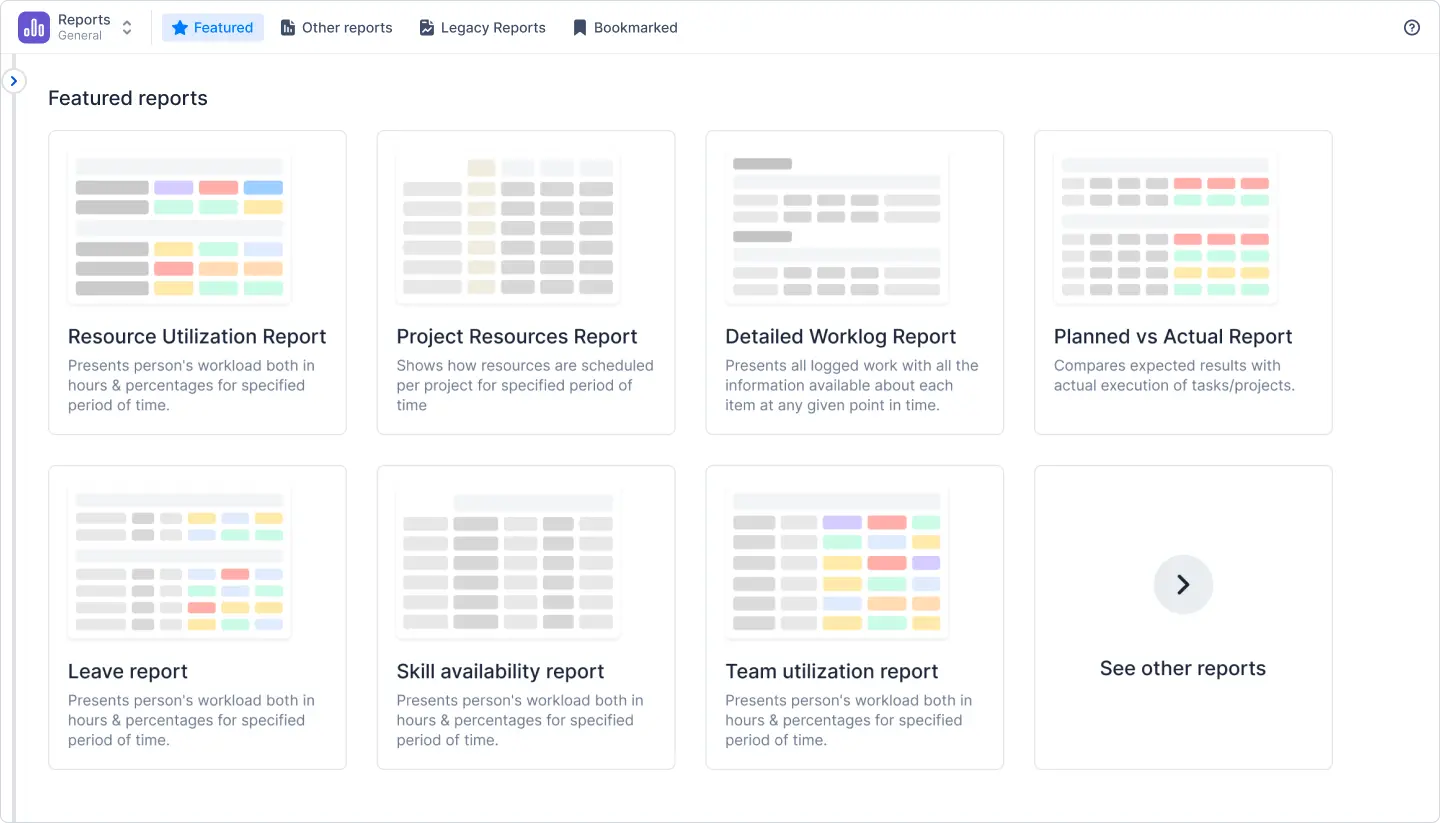
Reporting plays a big role in the analysis. The Project Manager or Resource Manager can find many reports in Jira. Two of them are especially helpful for basic resource planning: the Time Tracking Report and the User Workload Report. You can find them in the Reports section of every Jira project.
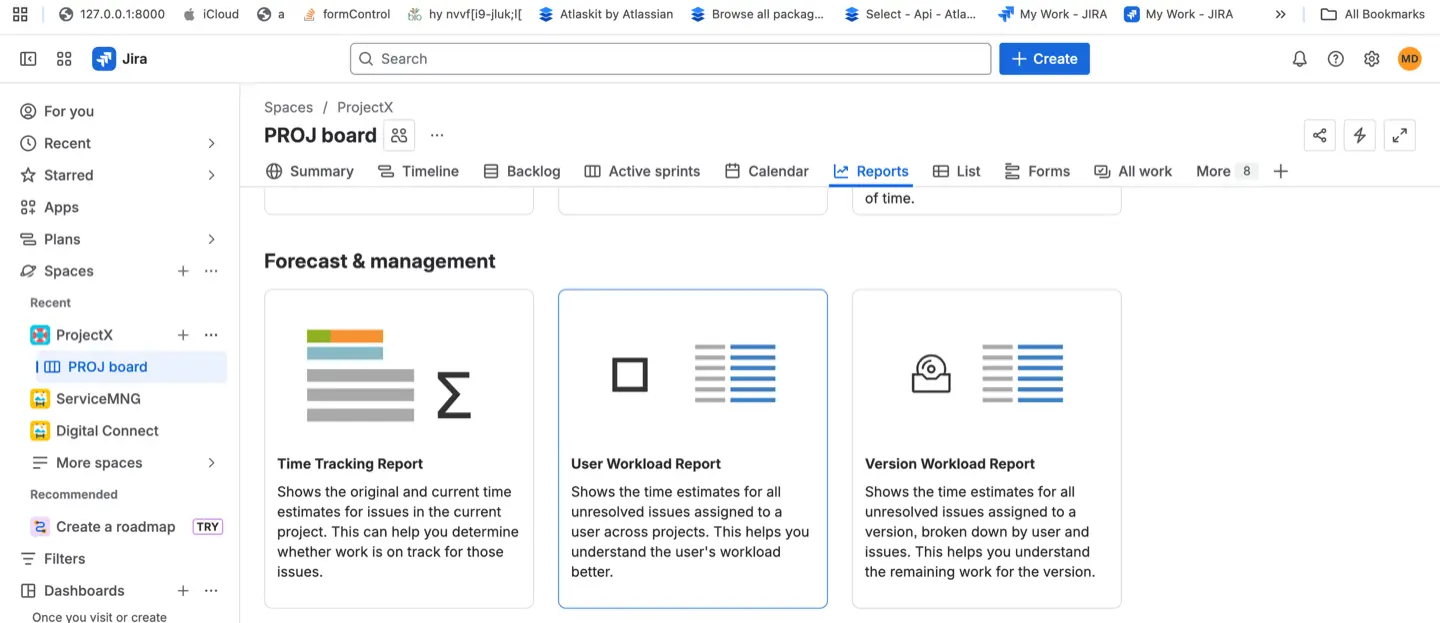
The User Workload Report shows how much work is assigned to a specific person. It displays the unresolved issues assigned to them and their remaining workload across different projects.
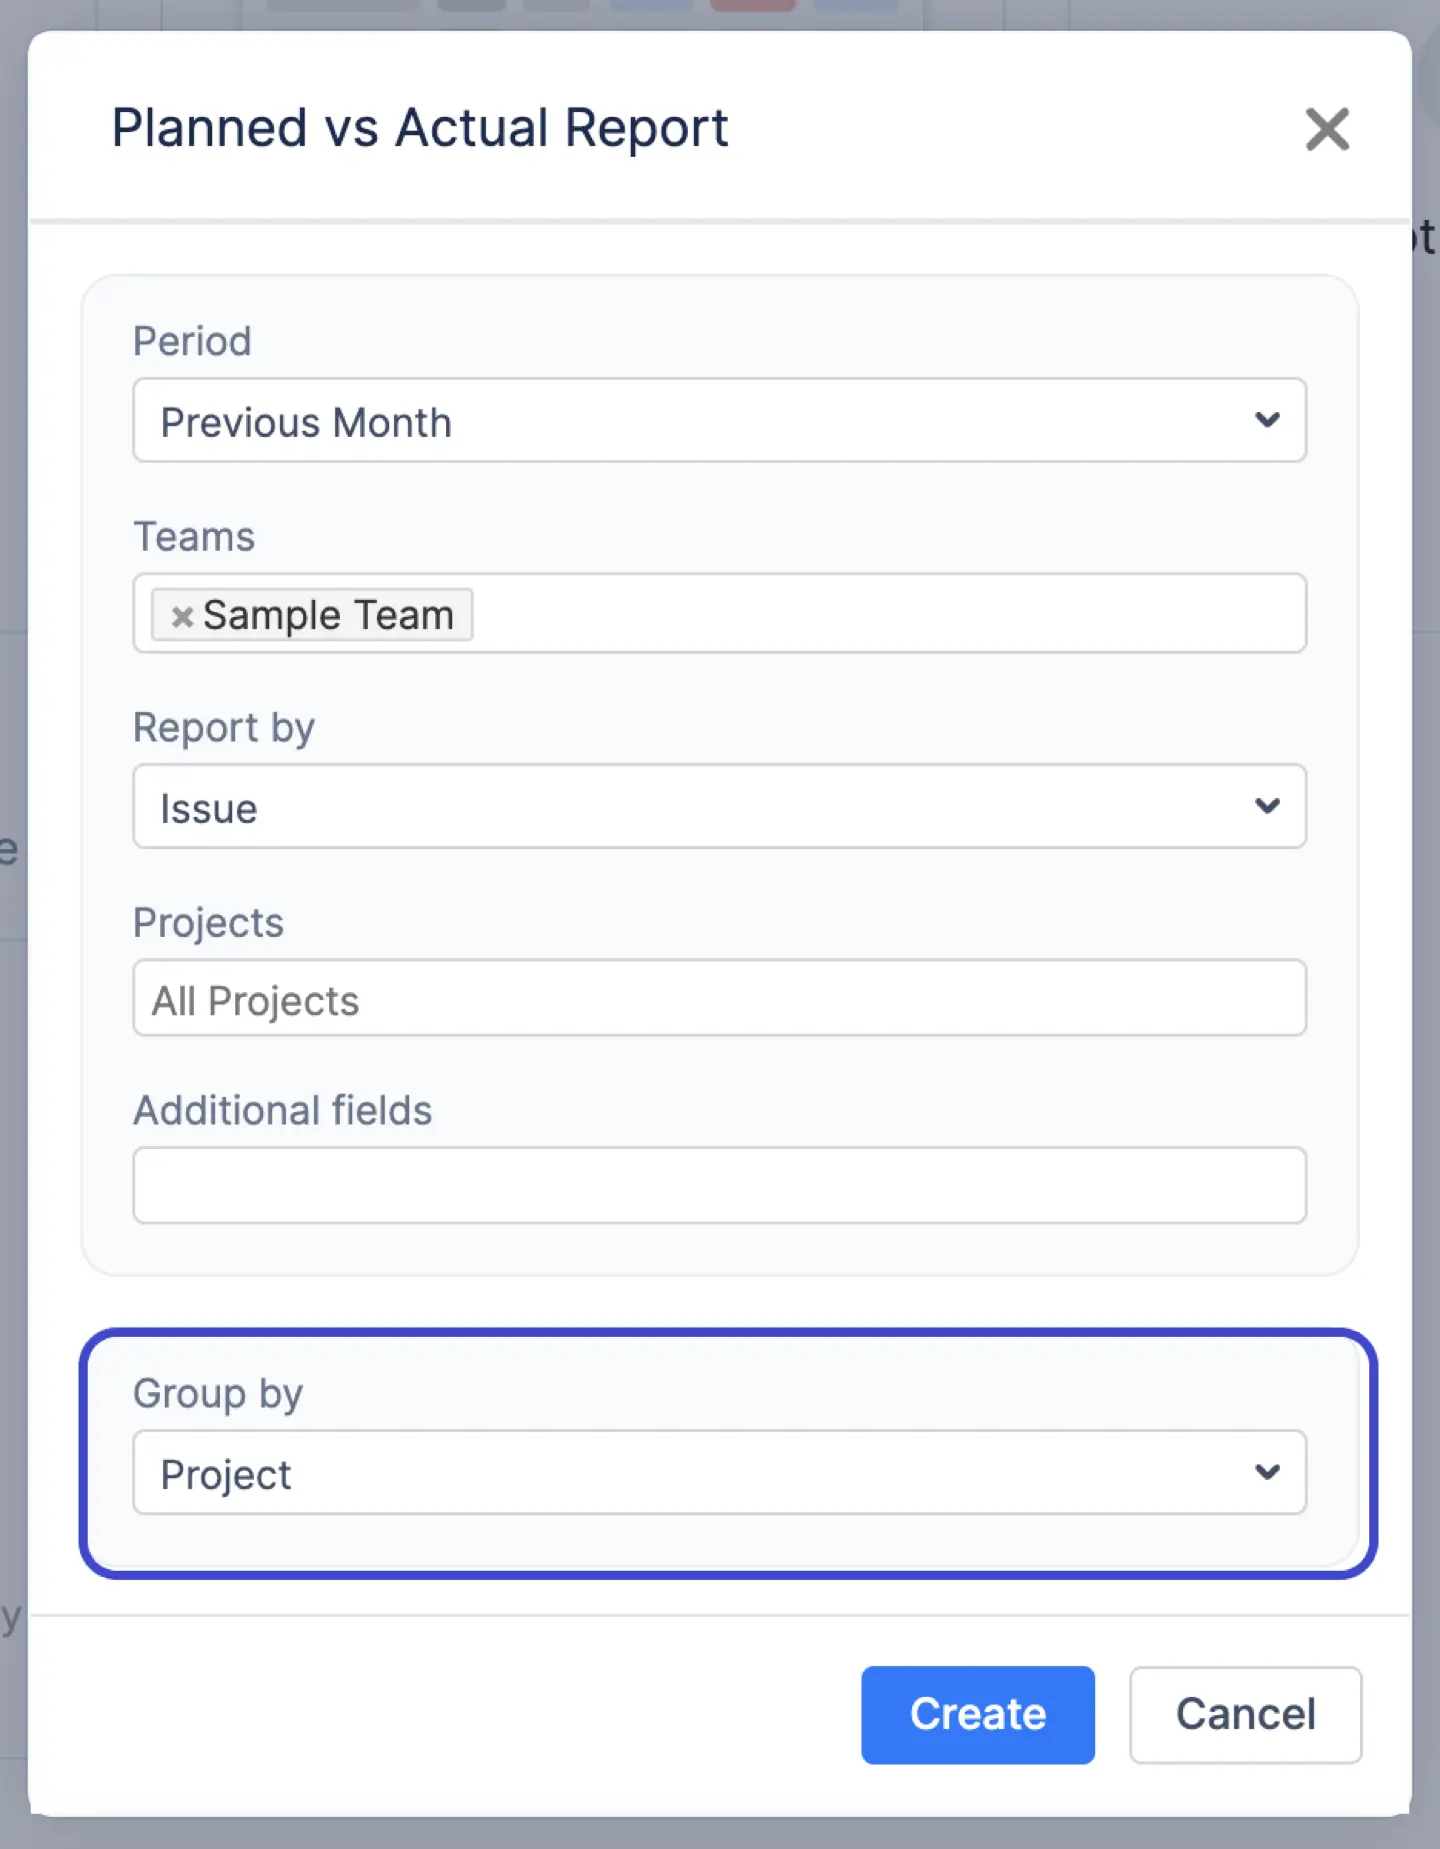
To create a report, follow these steps:
- Open your project in Jira and click the Reports tab in the sidebar.
- Search for the report you need. If you don't see it, check the "All Reports" category.
- Configure the settings.
- Click Next to generate the report.
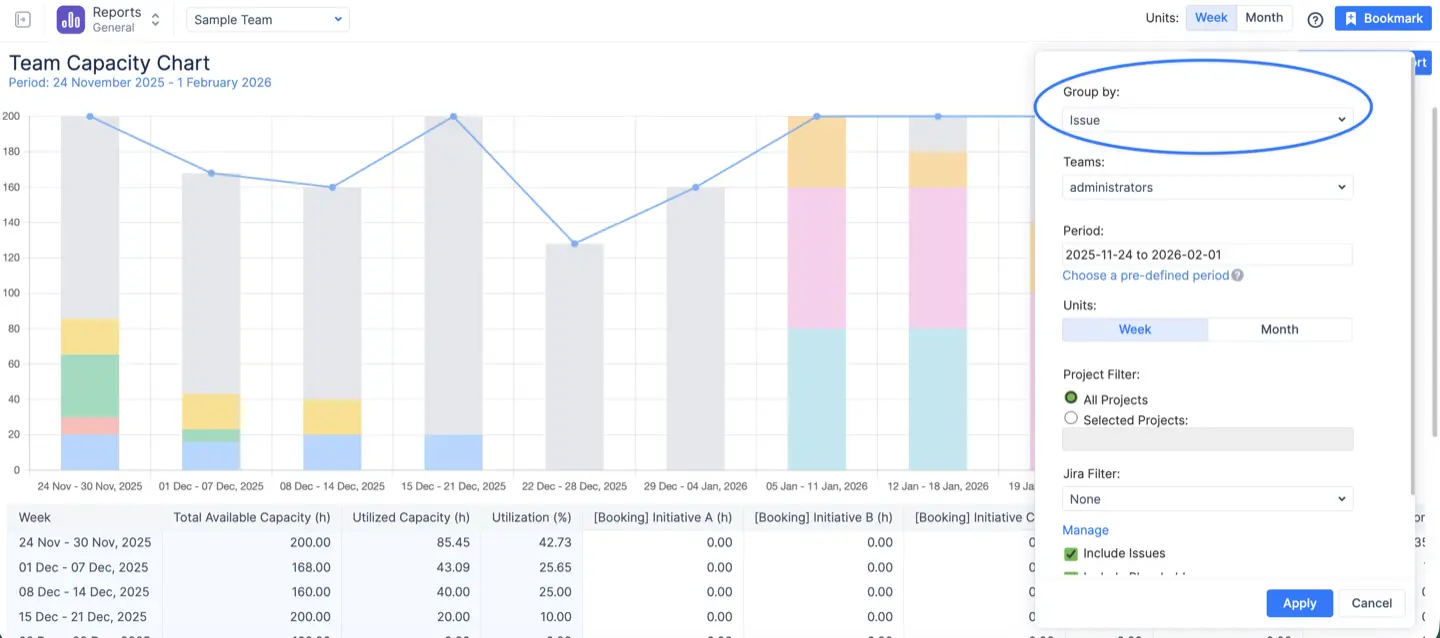
ActivityTimeline Resource Reports
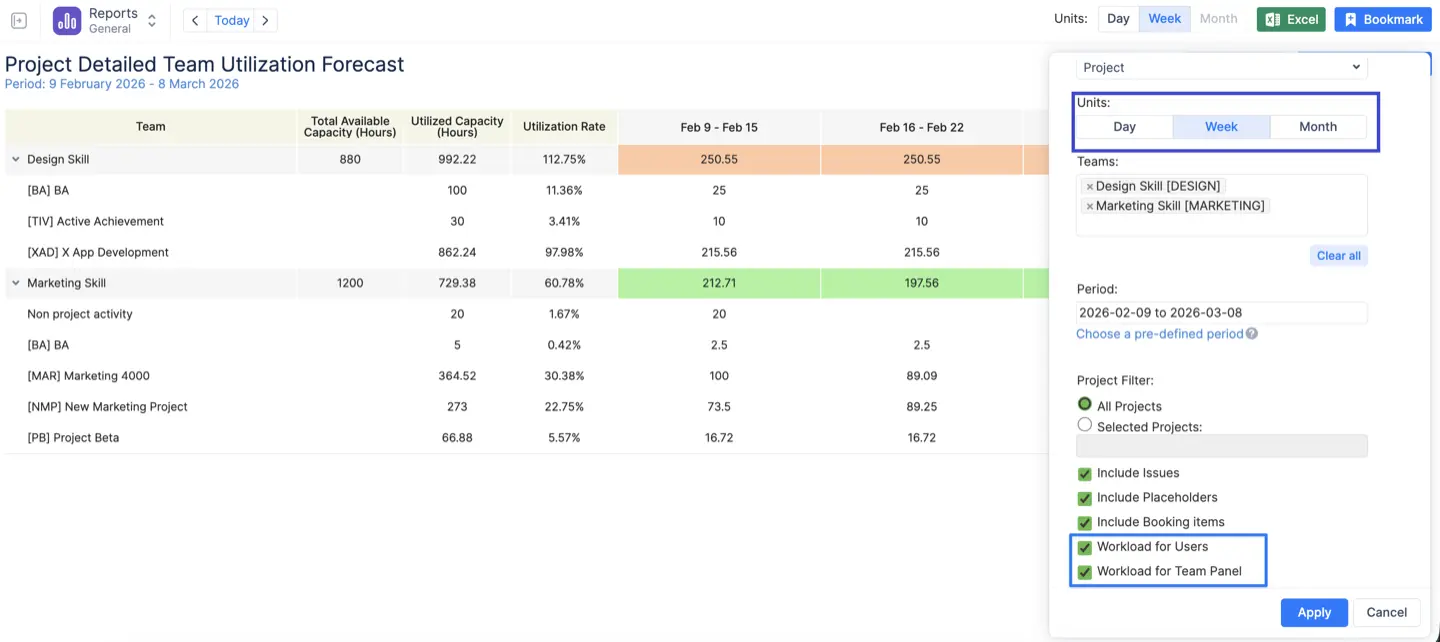
The app is fully synchronized with Jira. All data is reflected on a planning dashboard that shows current projects and tasks. It provides a cross-project view for shared resources and creates timesheets for improved resource allocation.
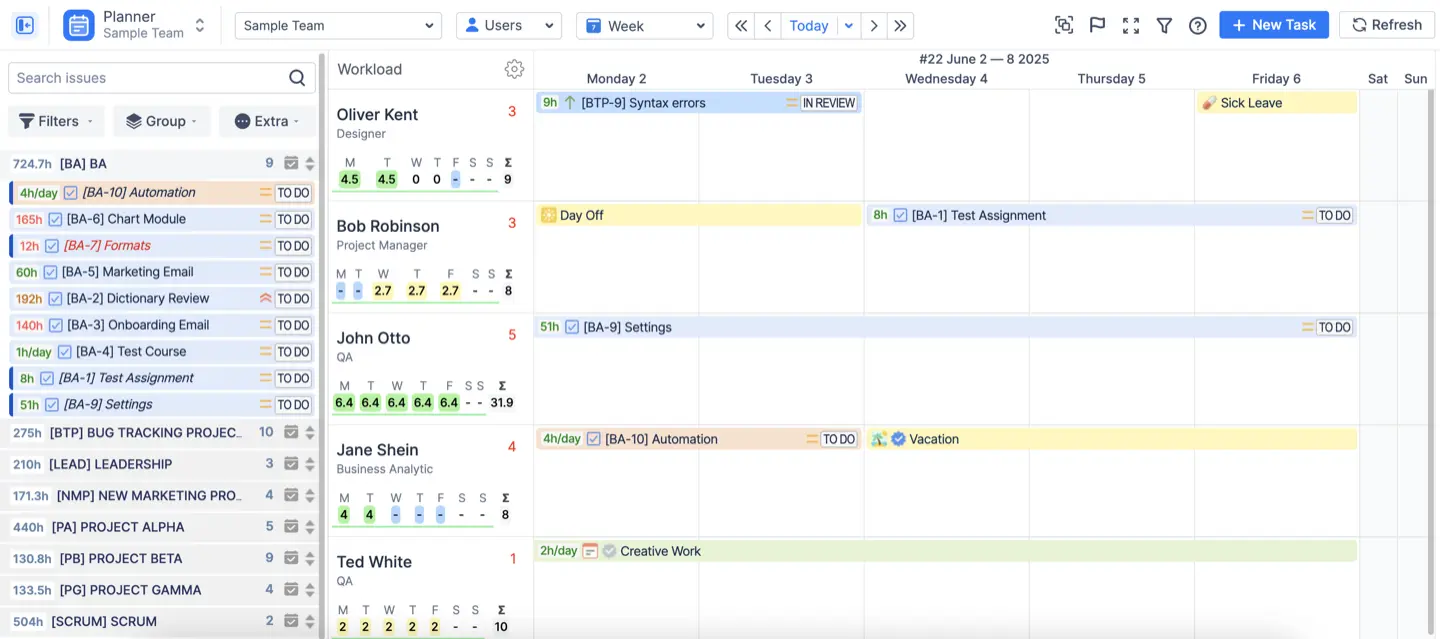

Manage Resource Utilization with ActivityTimeline
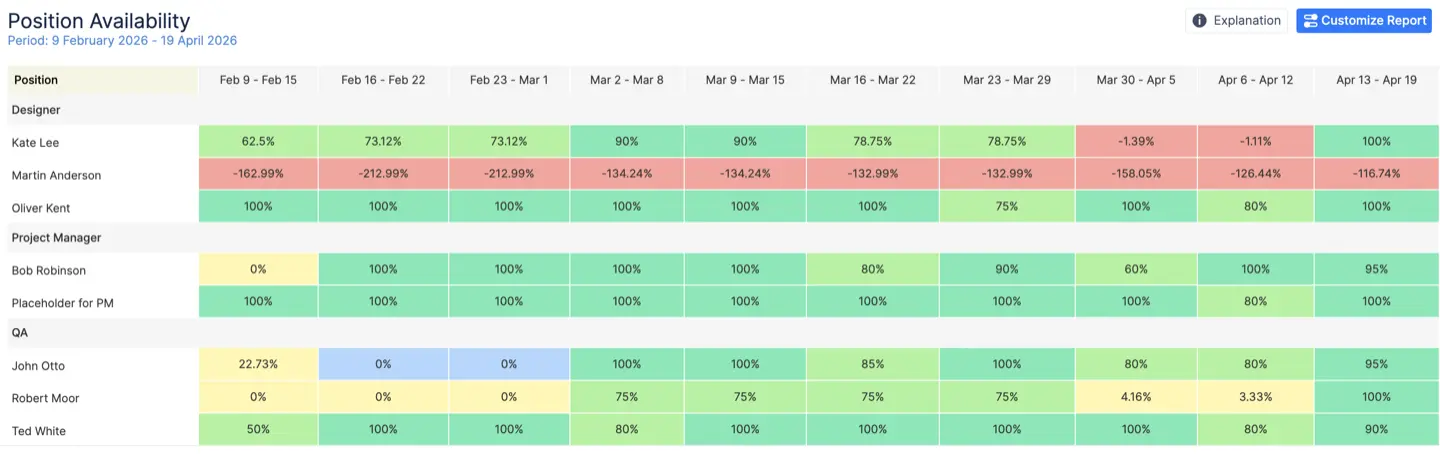
It is also important to keep an eye on the resources skills and expertise level. Every project has specific requirements. By checking job roles and a utilization report, you can ensure the right people are on the right tasks. Managers can then decide if the team requires upskilling or if resources should be moved to different parts of the project.
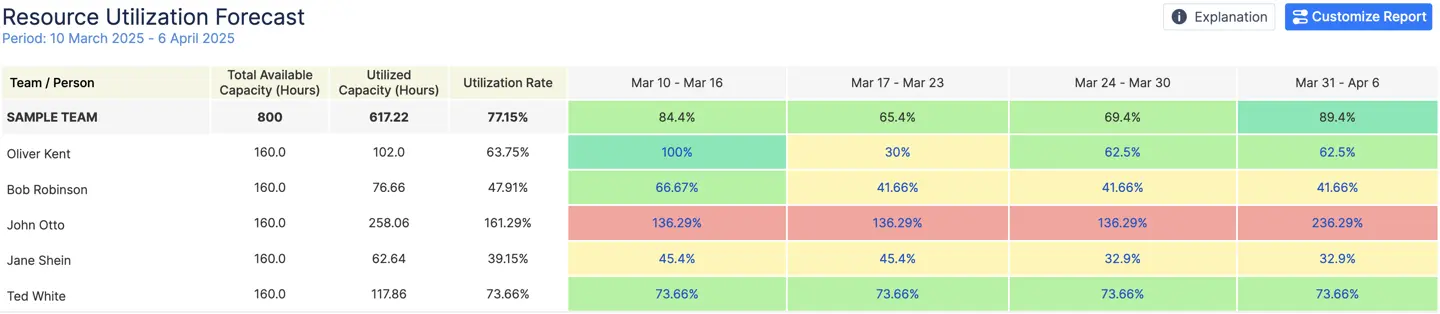
A utilization report in Jira makes resource allocation effortless. You can separate billable hours from non-billable tasks to see exactly where time is going. Get a clear picture of the resource capacity with the help utilization reports generated on specified key metrics.
To learn more about ActivityTimeline Schedule a Demo or Start a Free Trial on the Atlassian Marketplace!


