{{tl-dr}}
You’re in a project review meeting. A stakeholder leans in and asks a simple question: "What is our development team really spending their time on?" You have access to hundreds of Jira tickets, but the honest answer is, you don't really know. Is it new features? Bug fixes? Unplanned "shadow work"? Your time tracking data exists, but it's trapped in a black box of lists and logs.
This isn't just a Jira reporting inconvenience; it's a strategic disaster. Without a clear understanding of time allocation, you can't have effective resource utilization. You overcommit to new projects, fail to explain why key initiatives are lagging, and watch your profit margins shrink as non billable time silently eats away at your budget. You’re managing a team, but you’re steering without a map.
The High Cost of Flying Blind
When you can't easily see your team's workload distribution, every decision is a gamble. You might approve a new project thinking you have the capacity, only to discover your most critical team member is already spending 60% of their actual hours on maintenance tasks. This is how scope creep happens, how burnout becomes inevitable, and how even the best project managers end up missing deadlines.
Standard utilization reports often fail to provide the context you need. They might tell you if your team is busy, but not what they are busy with. This lack of insight makes it impossible to improve resource utilization or have meaningful conversations about priorities.
{{rich-cta-1}}
A Flashlight for Your Team's Black Box: The Team Utilization Pie Chart
It’s time to trade your spreadsheet for a spotlight. The ActivityTimeline’s Team Utilization Pie Chart is designed to give you instant clarity on one of the most important key metrics in project management: where your team’s effort is actually going.
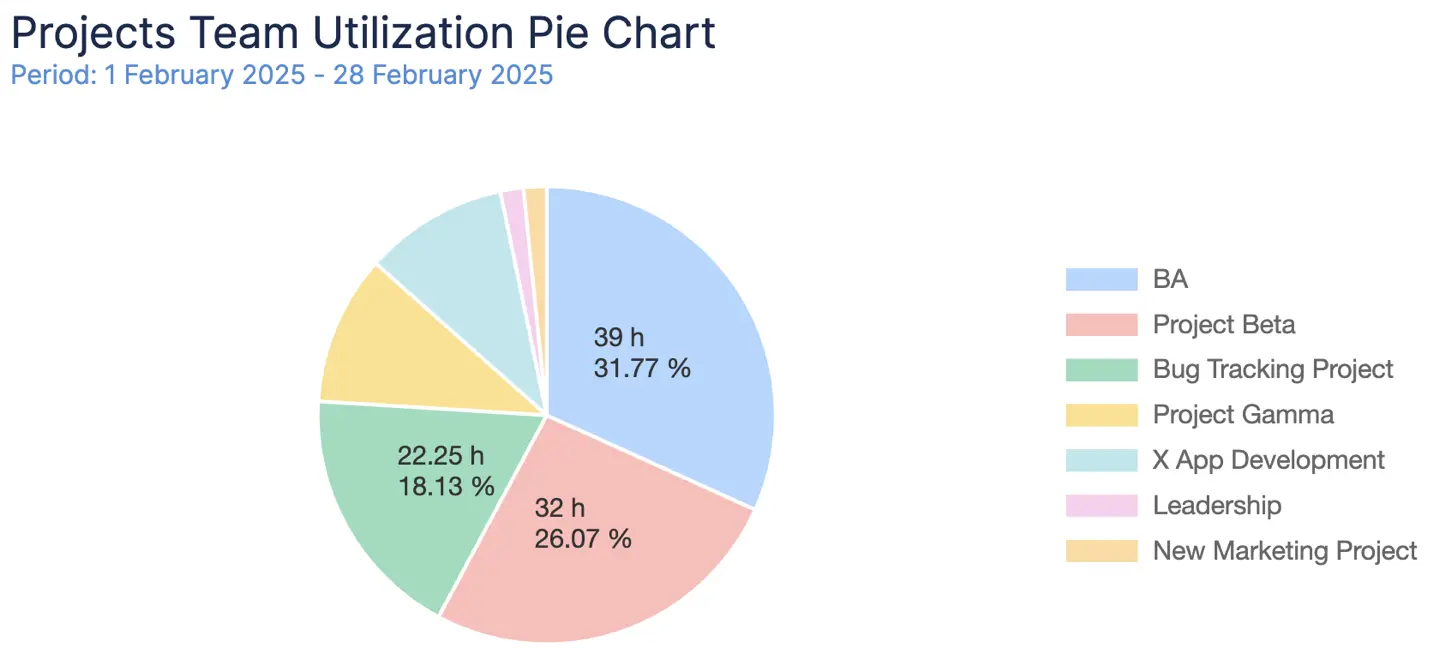
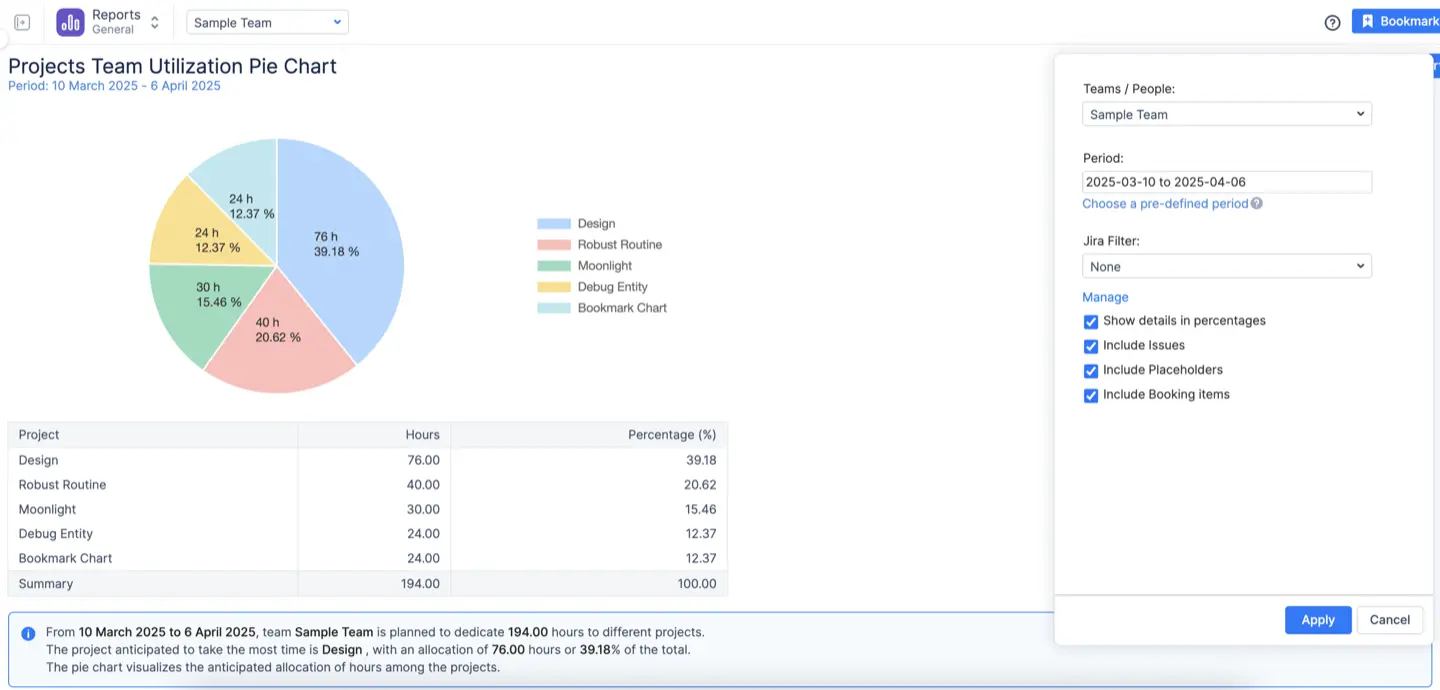
A Team Utilization Pie Chart is a visual report in ActivityTimeline that breaks down a team's time allocation across different projects or work categories. Instead of a confusing list of logged work hours, you get a simple, intuitive pie chart where each slice represents a project, showing exactly what percentage of your team's time it consumed.
This chart provides a powerful, high-level overview that helps you:
- Visualize Time Distribution: Instantly see how your team’s effort is divided across various projects.
- Identify Focus Areas: Pinpoint where your team’s time is most concentrated, ensuring it aligns with your most important project goals.
- Analyze Historical Workload: Look back at a completed period to understand how time was actually spent, which is crucial for improving future estimates.
Past vs. Future: Your Time Machine for Resource Planning
The true power of the Team Utilization Pie Chart lies in its ability to look both backward and forward. The "Reporting Scope" setting acts like a time machine for your resource planning.
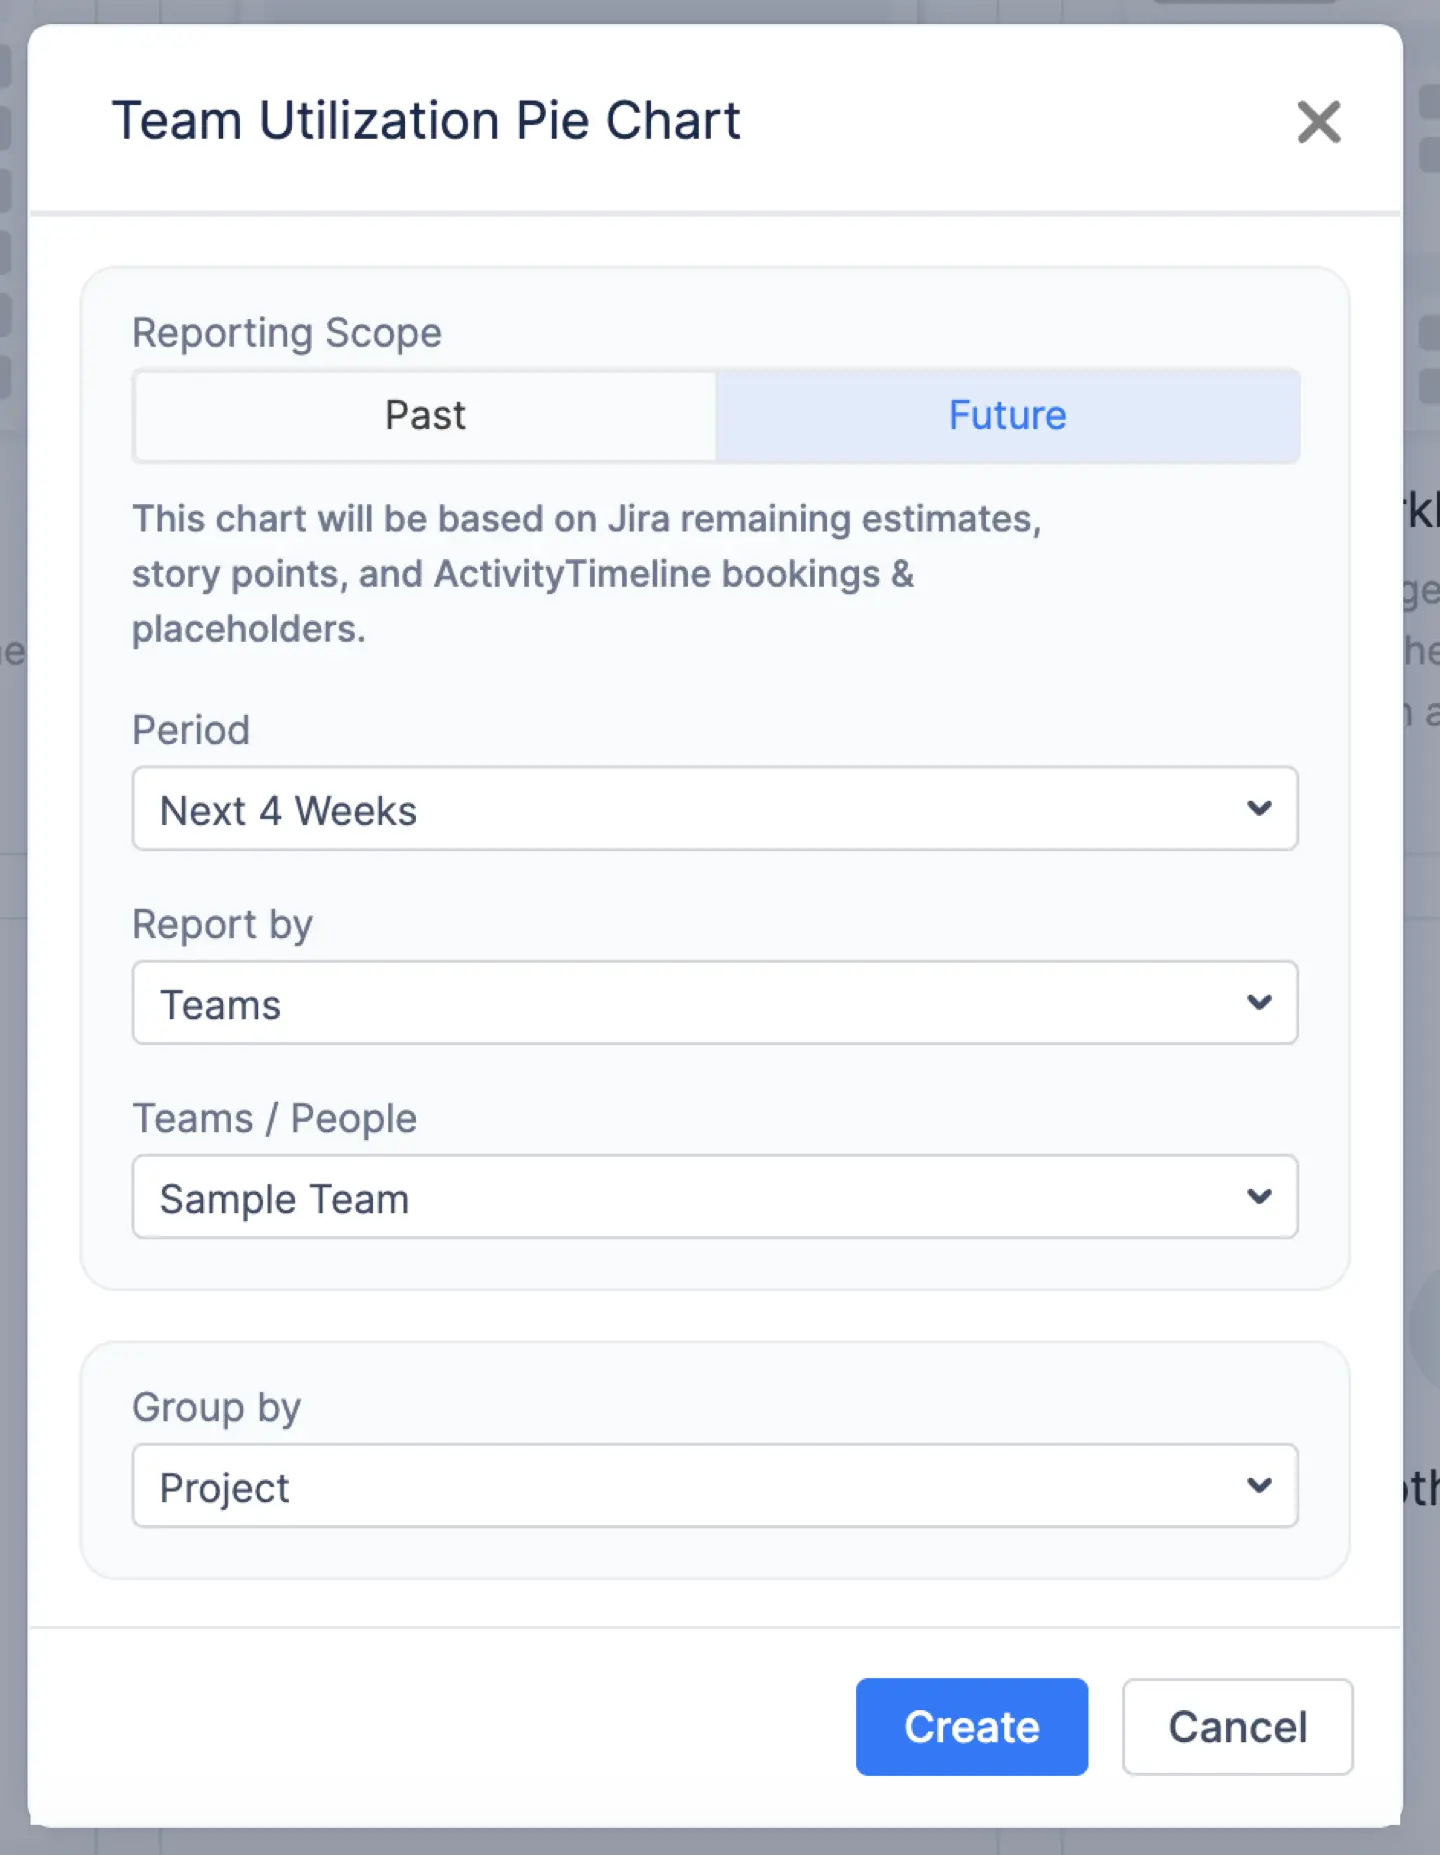
- Analyze the Past (Worklogs): By selecting "Worklogs" as your data source, the report analyzes historical time tracking data. It pulls all logged time, bookings, and imported calendar events to show you exactly how your team's actual hours were spent during a completed period. This is perfect for sprint retrospectives and performance reviews.
- Forecast the Future (Estimates): Switch the scope to "Estimates," and the chart transforms into a forecasting tool. It uses the remaining estimates on Jira issues, future bookings, and placeholders to predict how your team's time will be allocated in an upcoming period. This allows you to spot potential resource conflicts long before they happen.
How to Slice and Dice Your Utilization Data
A great utilization report should be flexible. ActivityTimeline allows you to filter and group your data to get the exact insights you need.
You can easily filter the report by specific teams or use a Jira Filter to narrow down the issues included. But the real power comes from the "Group by" option, which lets you categorize the data by:
- Project: The default view, perfect for seeing the time distribution across different active projects.
- Epic: Get a higher-level view by grouping time spent on larger initiatives. This is invaluable for agile project management.
- Jira Custom Fields: This is a game-changer. You can group your team's utilization by custom fields like "Issue Type" or "Worklog Category." Want to know if your team is spending more time on new features versus bug fixes? Now you can see it in seconds. This level of customization helps you identify areas for process improvement and optimize your planning strategies.
Stop Guessing, Start Knowing
In today's fast-paced environment, making data-driven decisions is not optional. The Team Utilization Pie Chart is more than just another one of many chart reports; it's a strategic tool that replaces ambiguity with clarity. It gives you the valuable insights needed to have honest conversations about priorities, justify resource allocation, and ensure your team is focused on the work that matters most. Stop managing in the dark and start leading with data.
{{rich-cta-2}}


![Jira Teams with ActivityTimeline: Comprehensive Guide [2026]](https://cdn.prod.website-files.com/60c76f07dc83db305171350c/6a15952034cfc5cca020eedd_thumbnail_Jira%20Teams%20with%20ActivityTimeline.png)