
{{tl-dr}}
PM success hinges on two critical factors: accurate planning and efficient execution.
Yet, even the most meticulously laid plans can unravel without a robust mechanism to track deviations between what was intended and what actually occurred. This gap—the chasm between planned and actual time—is where projects often go astray, leading to budget overruns, missed deadlines, and a frustrated workforce.
Many use utilization reports to catch that. You need a data-driven approach to pinpoint exactly where your projects are deviating, understand why, and take corrective action before it’s too late. ActivityTimeline delivers this crucial capability with its powerful Planned vs. Actual reports and charts, transforming opaque project performance into crystal-clear insights.
The Disconnect: When Plans Meet Reality
The reality of project execution rarely mirrors the initial Gantt chart perfectly. Several factors contribute to this pervasive disconnect:
- Optimistic Estimations: Teams often underestimate complexity or unforeseen challenges, leading to initial plans that are simply unachievable.
- Scope Creep: Requirements expand incrementally, adding unplanned work that silently drains resources and extends timelines.
- Unforeseen Obstacles: Technical hurdles, external dependencies, or resource availability issues can throw even well-planned projects off course.
- Inefficient Workflow: Internal process inefficiencies, communication breakdowns, or task dependencies can lead to wasted time and delays.
- Lack of Real-time Feedback: Without continuous monitoring, deviations go unnoticed until they become critical, forcing reactive, often costly, interventions.
This constant drift between planned and actual often leaves project managers in the dark, making it difficult to assess true project health or learn from past performance.
Bridging the Gap: The Planned vs. Actual Report in ActivityTimeline
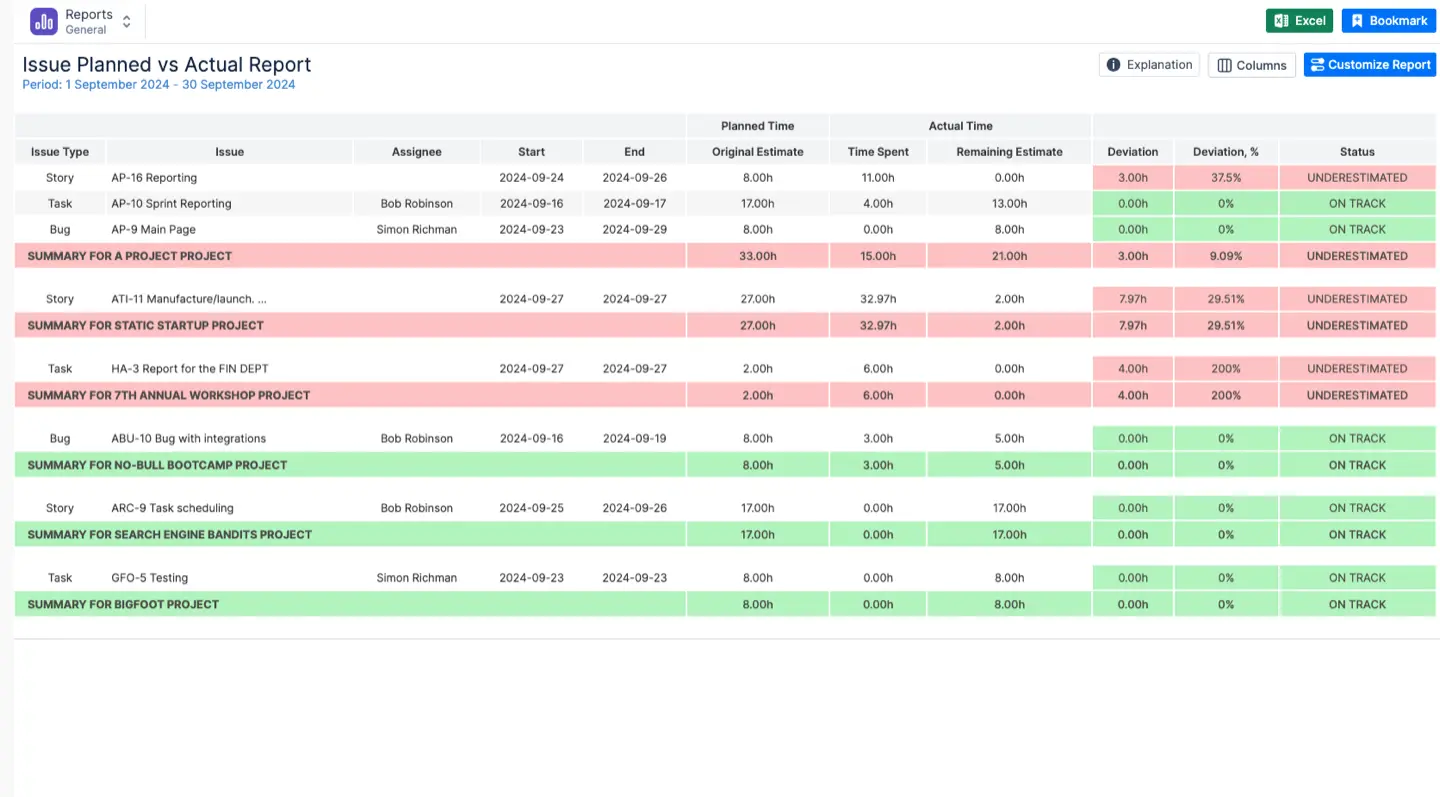
ActivityTimeline’s Planned vs. Actual Report is explicitly designed to "compare expected results with the actual execution of tasks/projects". This report is your microscope, allowing you to "spot the difference between original estimate & actual execution to understand the bottlenecks of the project".
This powerful reporting tool lives within the Reports module of ActivityTimeline, which is accessible to various roles including Administrator and Manager. It serves as a key component of the "Tracking" group of reports, which focuses on comparing "time planned and time spent on specific JIRA tickets for a defined period of time".
{{rich-cta-3}}
Deconstructing Project Performance: What the Data Compares
The Planned vs. Actual Report offers a nuanced comparison by examining three core data points for each task or project:
- Original Estimates: This refers to the initial time anticipated for a task or project. ActivityTimeline can read both hours and story points estimations, converting story points into hours if a conversion factor is determined.
- Time Spent (Actual Execution): This captures the real-world time logged by your team members against tasks. ActivityTimeline synchronizes worklogs directly from Jira and also allows users to log time through its interface.
- Remaining Work: This indicates the estimated effort still required to complete the task.
By juxtaposing these metrics, the report provides a dynamic snapshot of your project's progress and potential deviations.
Unlocking Insights: What the Report Reveals
The true power of the Planned vs. Actual Report lies in the insights it provides:
- Identifying Scope Creep: If the "Time Spent" significantly exceeds the "Original Estimate" without a corresponding increase in "Remaining Work" (or if new tasks appear that weren't originally estimated), it's a strong indicator of scope creep.
- Spotting Estimation Errors: Consistent discrepancies across similar task types can reveal patterns of over- or under-estimation, allowing your team to refine future planning.
- Assessing Team Performance & Bottlenecks: The report can highlight which tasks or projects are consistently taking longer than planned, potentially pointing to inefficiencies, skill gaps, or individual bottlenecks within the team.
- Resource Management Effectiveness: By understanding where planned time diverges from actual effort, you can evaluate the accuracy of your initial resource allocations and capacity planning.
Interpreting the Results
The report allows you to "Choose a project and team, time frames, and acceptable deviation". This "acceptable deviation" threshold helps you quickly identify significant discrepancies. For instance, if a task was planned for 10 hours but has 15 hours spent and still 5 hours remaining, a deviation indicator will alert you to this overrun.
The visual representation, often with color coding, will draw your attention to:
- Tasks Over Budget/Time (Red): These are critical areas needing immediate attention.
- Tasks On Track (Green): Confirming successful execution within planned parameters.
- Tasks Under Budget/Time (Yellow): Potentially indicating over-estimation or highly efficient work.
Course Correction Based on Findings
Armed with these insights, you can implement timely course corrections:
- Re-estimating & Re-planning: For tasks with significant overruns, collaborate with the team to re-evaluate the remaining effort and adjust future plans accordingly.
- Scope Re-negotiation: If scope creep is identified, initiate discussions with stakeholders to either adjust expectations or formally expand the project scope.
- Process Optimization: Investigate why certain task types consistently run over. Is there a need for clearer instructions, better tools, or improved communication?
- Resource Reallocation: If specific team members or skill sets are consistently overloaded, reallocate tasks or bring in additional support to balance the workload.
- Training & Development: Persistent estimation errors in specific areas might indicate a need for training to improve the team's ability to accurately gauge effort.
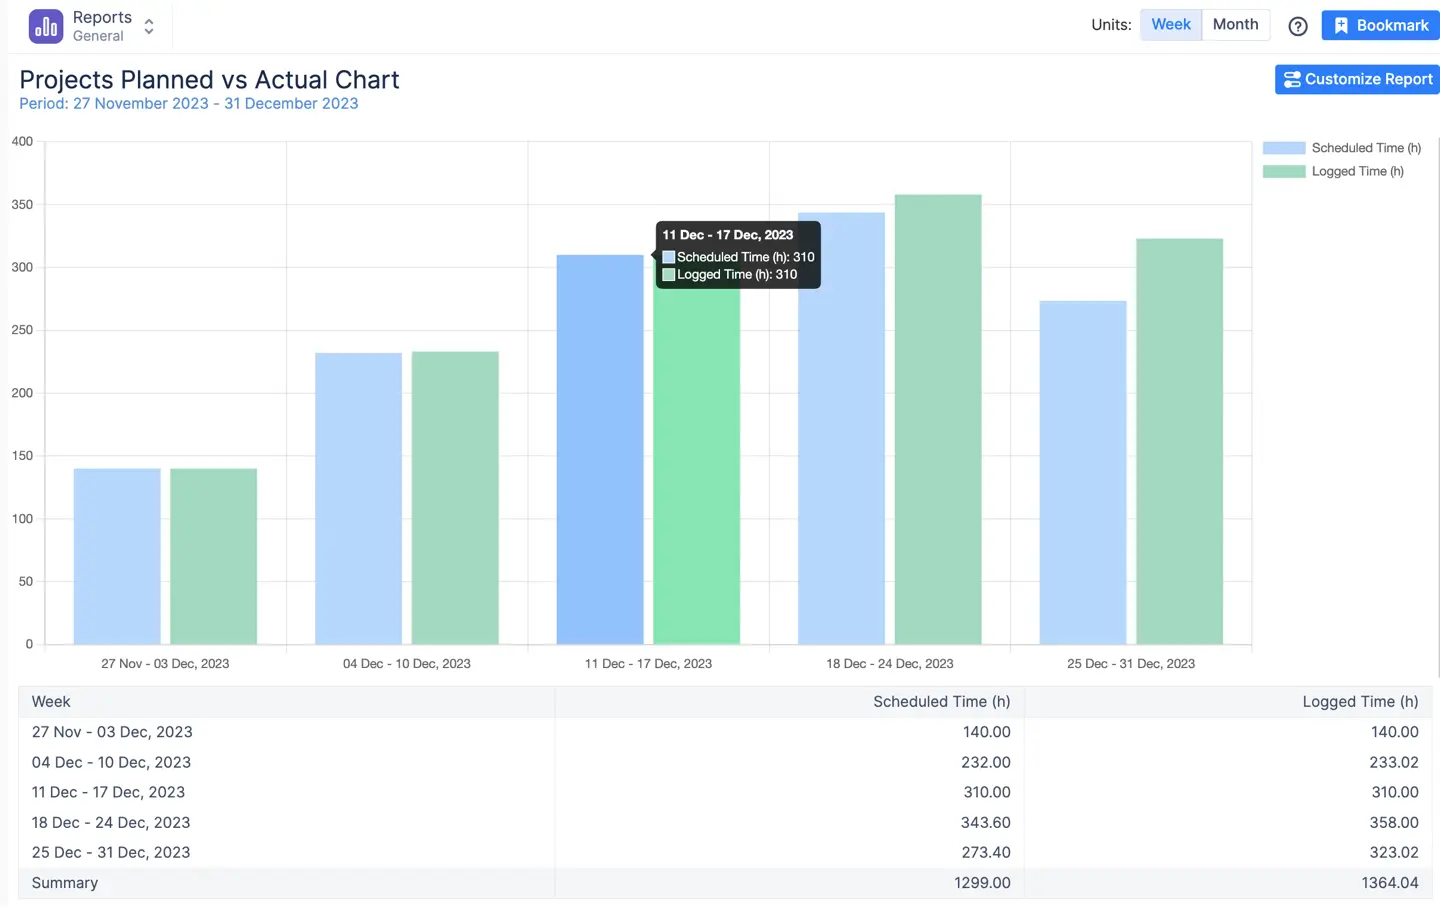
ActivityTimeline's Planned vs. Actual Chart transforms historical data into a powerful learning tool. It moves you from reactive firefighting to proactive, data-driven decision-making, ensuring your projects are not only executed, but executed with precision.
ActivityTimeline Wants to Fix Your Broken Project Management
Remember the last time your star developer burned out mid-sprint? Or when three team members sat idle while one person crushed under impossible deadlines? ActivityTimeline thinks it has the answer.
Many teams tackle what founders call "the blindness problem" — project managers making resource decisions with incomplete information. Unlike Jira's isolated project boards, ActivityTimeline creates a unified view across all projects, showing exactly where your team stands.
The burnout detector
The company's signature feature is dead simple: a traffic light system for workloads. Red means someone's drowning, yellow signals underutilization, green hits the sweet spot. One beta customer, a 50-person engineering team, cut overtime by 30% just by spotting overloaded developers before they hit the breaking point.
Sprint planning that actually works
For agile teams, ActivityTimeline automatically maps Jira tasks to individual timelines using sprint dates. No more manual scheduling headaches. Milestones mark key deadlines, creating what the team calls "a GPS for project delivery."
The platform's Planned vs. Actual reports reveal the brutal truth about time estimates. Teams can spot bottlenecks and identify serial under-estimators — invaluable intel for future sprints.
Beyond code and tickets
ActivityTimeline tracks everything, not just development tasks. Team meetings, training sessions, vacation days, even equipment bookings. The platform calculates true availability, factoring in that conference room reservation or Sarah's doctor appointment.
When integrated as Jira's time-tracking provider, it adds features power users have been begging for: multi-day time logging, worklog categories, and table views that actually make sense.
{{rich-cta-4}}