Finance teams and project managers share a common frustration: Jira tells you what is happening, but not what it costs.
Native Jira is built for task tracking, not financial reporting. It has no concept of hourly labor rates, profit margins, or budget burn. Getting a cost picture typically means exporting worklogs to a spreadsheet, manually applying salary data, and reconciling fixed expenses — a process that is slow, error-prone, and already stale by the time it is finished.
ActivityTimeline's Finances module is built to close the gap in Jira reporting for finance teams. It sits on top of your existing Jira data and turns the time your team logs into live financial intelligence — without requiring a separate finance tool, a manual export, or complex calculations.
The Data Foundation: How Costs and Revenue Are Calculated
Before exploring the cost management reports, it helps to understand what powers them. Three things feed the Finances module: scope, rates, and transactions.
Scope defines which Jira work the budget monitors. You draw a fence around a specific body of work — one or more Jira projects, a set of Epics, or a saved JQL filter for highly customized tracking (for example, "all high-priority issues assigned to the Dev Team this quarter"). Everything inside the fence is tracked. Everything outside is not.
Labor rates are what convert logged hours into money. Every team member can carry two rates: a Cost Rate (what they cost the company) and a Billing Rate (what the company charges the client). When a worklog is recorded in Jira, ActivityTimeline multiplies the hours by the applicable rate and adds the result to your financial totals.
The system uses a strict rate hierarchy. Category-specific rates take priority — useful for pricing urgent or non-billable work differently. User-specific rates apply next. The budget's default rate is the fallback. This hierarchy means the most specific rate always wins, without requiring manual overrides.
Rates are also effective-dated. If a team member gets a raise, you set a start date for the new rate. Past worklogs stay costed at the old rate, while future work uses the new one. Historical reports remain accurate without any recalculation.
Manual transactions cover what Jira worklogs cannot: software licenses, travel costs, contractor invoices, fixed milestone payments, down payments, recurring subscriptions. These are added directly in the Finances module and flow into every report alongside labor data, giving you a complete Profit & Loss view rather than just a labor cost snapshot.
Three Reports, Three Lenses on Your Budget
Once scope, rates, and transactions are configured, ActivityTimeline’s reporting plugin generates three financial reports in real time, unlike Jira’s built-in reporting tools, whose standard features often help business teams track KPIs such as approval cycle time and request volume to track progress. Each answers a different question.
The Summary Dashboard: The Executive View
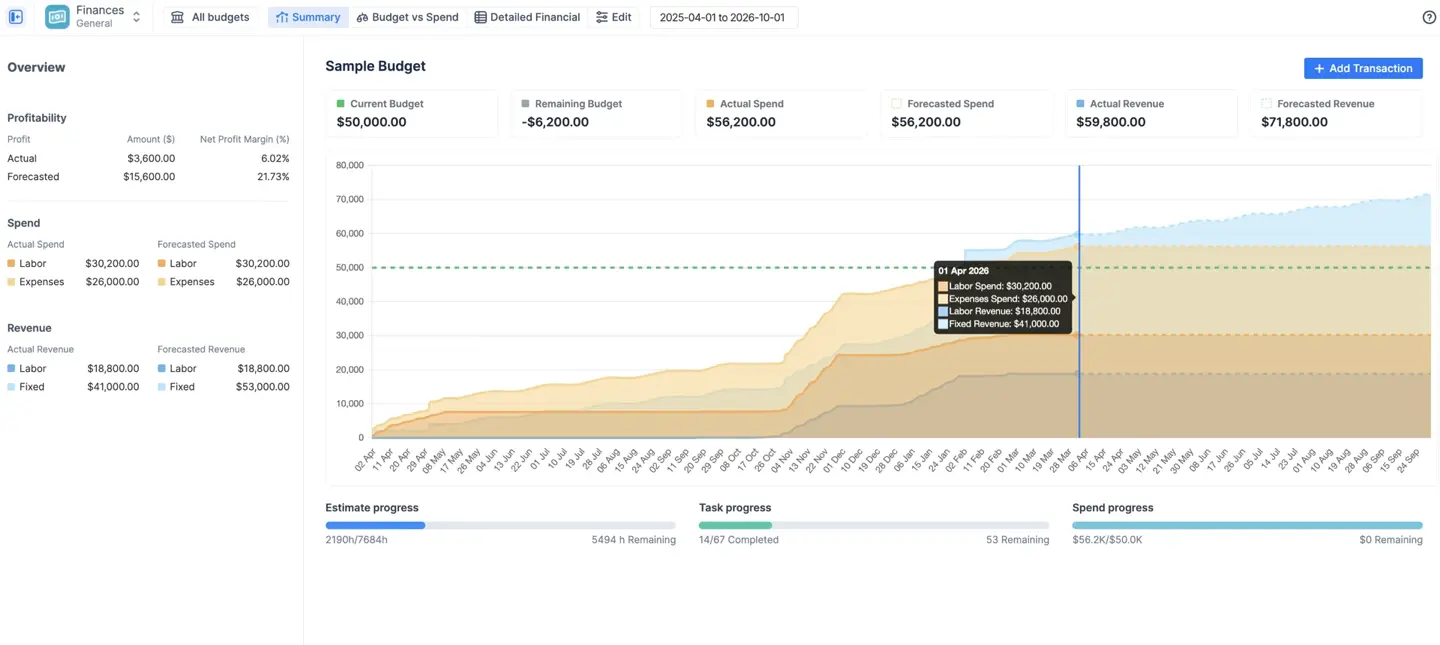
The Summary Dashboard is the first thing you see when you open a budget. It is designed to answer the most critical question in project finance: Are we on track, or are we going to run out of money?
Six KPI cards at the top give you the bottom line instantly: Current Budget, Remaining Budget, Actual Spend, Forecasted Spend, Actual Revenue, and Forecasted Revenue. Below them, a cumulative trend chart plots spend and revenue over the life of the project, with a clear visual warning if forecasted spend is on track to exceed the budget cap.
The dashboard also includes three progress bars that compare financial consumption against physical progress — showing what percentage of estimated hours have been logged, what percentage of tasks are complete, and what percentage of the budget has been spent. A project where 80% of the budget is consumed but only 40% of tasks are done is a red flag that surfaces immediately, without digging through Jira issues.
Budget vs. Spend: Catching Allocation Drift and Project Health
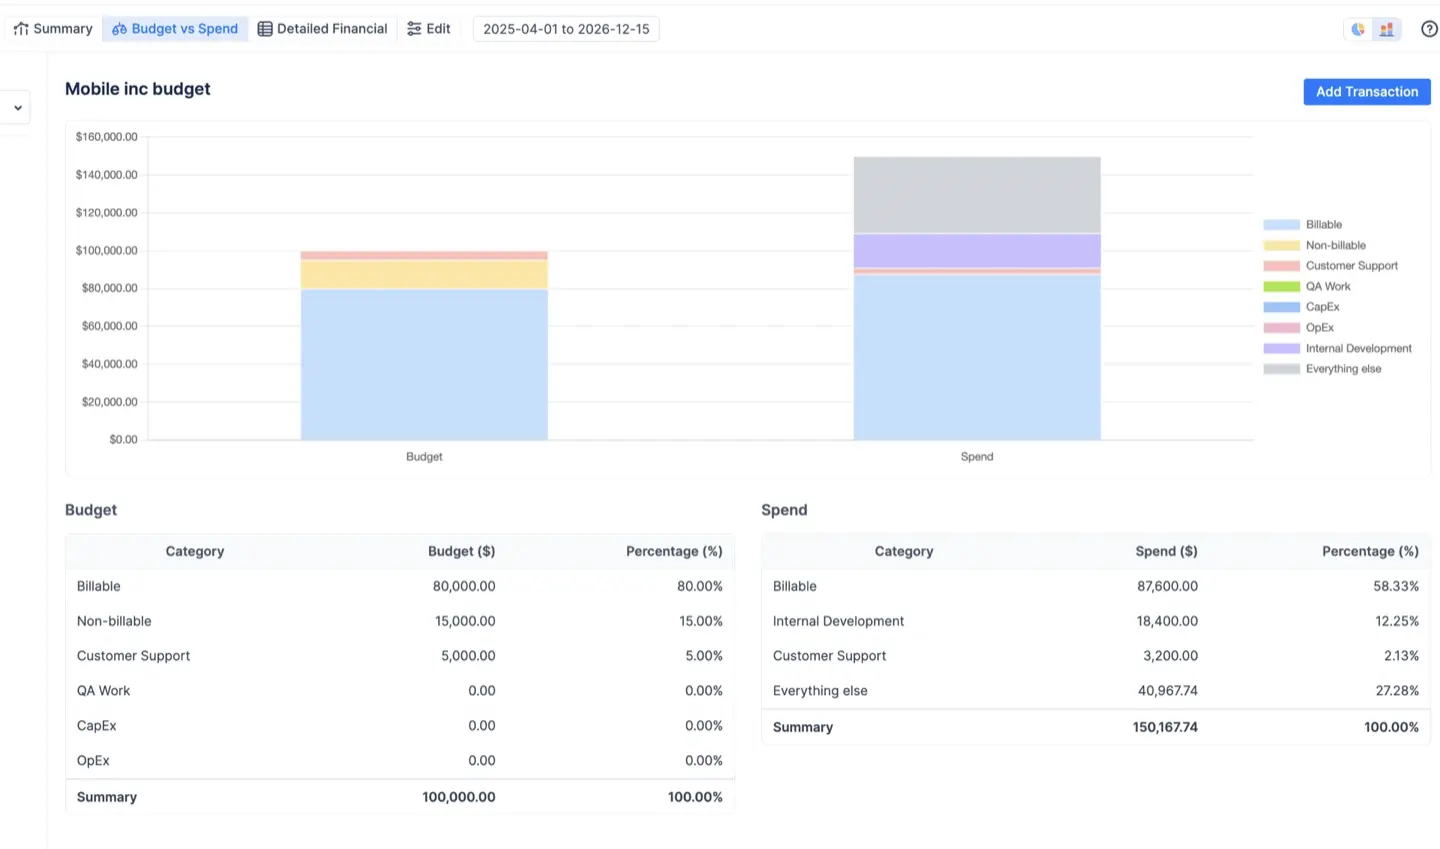
The Budget vs. Spend report is the strategic comparison tool. It answers a different question: Are we spending in the right places?
Project managers often allocate budgets by category (billable vs. non-billable work), by team, or by Jira project. This report compares those planned allocations against real-time actual spend, grouped by whatever dimension matters most at the moment, which is especially useful when finance leaders need to manage multiple projects and shifting priorities.
The value here is visibility into drift — situations where spending is moving away from the plan before it becomes a crisis. For example: you planned to spend 20% of your budget on non-billable internal work. The report shows that non-billable time is currently consuming 48% of your costs. That is a signal to act, visible immediately, without waiting for a month-end report, helping teams identify bottlenecks, spot delays, and surface risk before month-end.
The report offers two views. Pie charts show proportional distribution — useful for understanding where effort is going relative to the whole. Bar charts show absolute monetary values — critical for catching cases where proportions look healthy but total spend has already exceeded the budget cap. Both views are necessary, because a stable percentage can mask significant overspending in absolute terms.
Detailed Financial Report: The Auditable Ledger
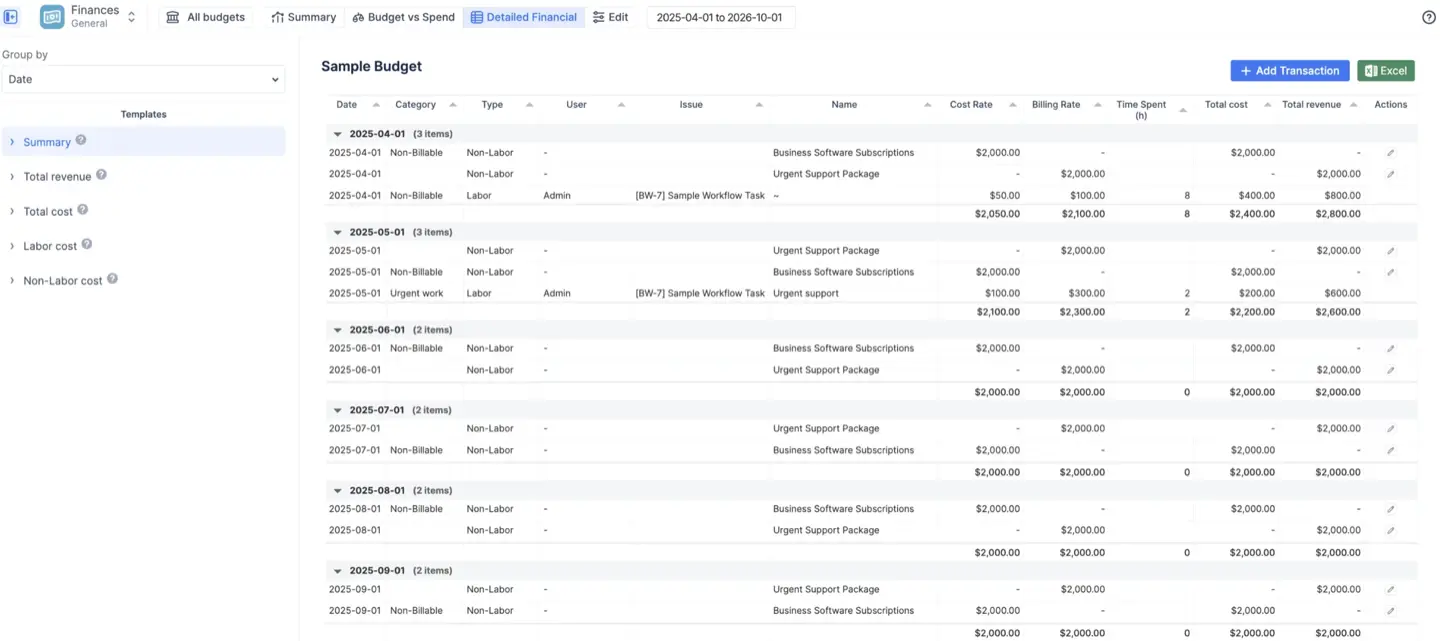
The Detailed Financial report is the line-by-line record of everything that makes up your financial totals. Every worklog, every manual transaction, every prorated monthly salary entry appears as its own row, with the applicable rate, the hours logged, and the resulting cost and revenue, giving deeper insights and additional context for each financial entry.
This report is designed for two audiences. Project managers use it to audit exactly who worked on what and what it cost. Finance teams use it to prepare invoices — filtering for billable revenue, setting a date range, and exporting to Excel in one click for contractor invoices, procurement tracking, or purchase requests.
Pre-built templates make the most common views instant: total revenue only, total cost, labor cost only (filtering out fixed expenses), or non-labor cost only (filtering out worklogs). The Group by feature collapses the ledger by category, project, user, or Epic, with subtotals for each group to help teams communicate financial details to stakeholders more clearly.
Data Security: Sharing Reports Without Exposing Salaries
Financial data is sensitive. ActivityTimeline addresses this with a layered access model, and those access controls matter for compliance in the finance department.
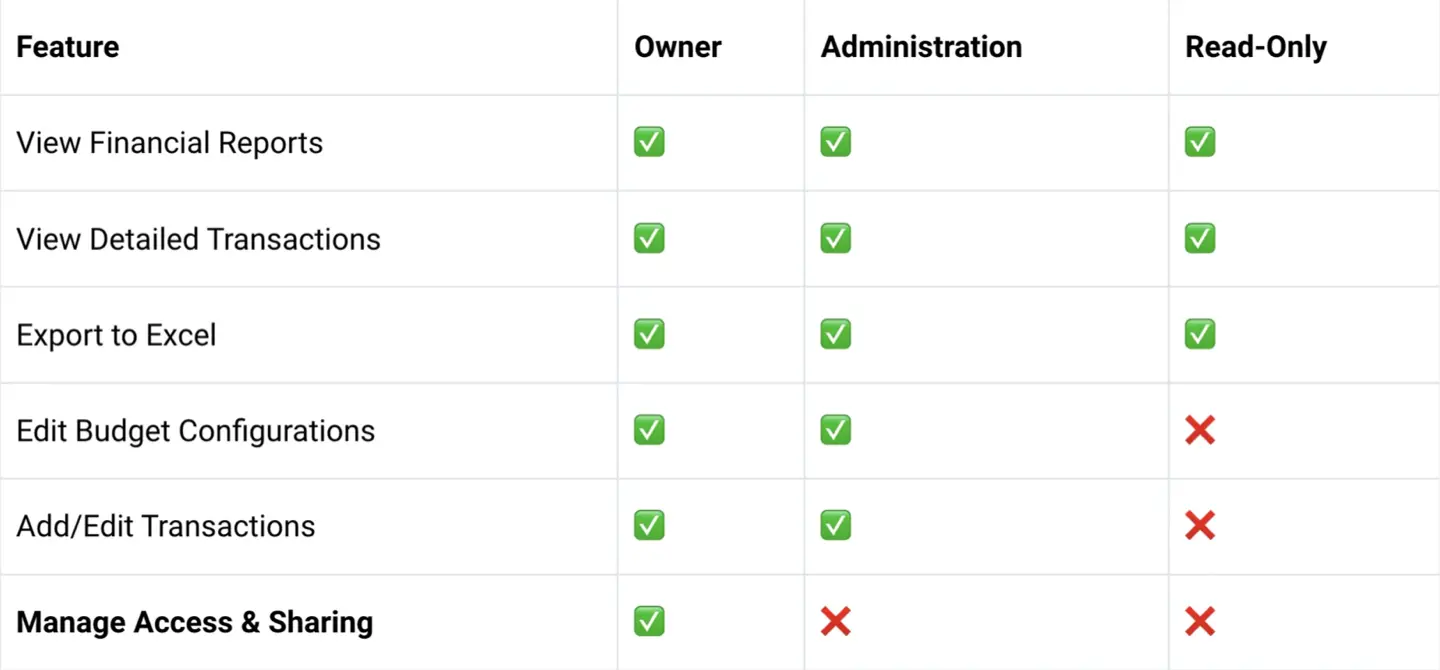
Each budget has an Owner (the creator), Administrators (co-managers who can edit configurations and transactions), and Read-Only users (stakeholders who can view reports and export data, but cannot modify anything). Critically, Read-Only users see the resulting costs and revenues in reports — but they cannot access the Labor Rates configuration tab, which is where the underlying rate cards and multiplier logic live. This means you can share project health data with a client or department head without exposing internal salary structures.
The module also mirrors Jira's own permission system. If a team member does not have access to a particular Jira project, they will not see the financial data associated with that project's worklogs, even if they have been granted Read-Only access to the budget. Financial visibility never bypasses the access controls already established in Jira, which is especially important in Jira Service Management or other service management setups where finance requests move through controlled processes.
For organizations that need tighter control over who can see the Finances module at all, a global configuration restricts access to a specific named user list — blocking access even for users with Manager or Team Lead roles.
Setting Up Your First Financial Report: A Step-by-Step Overview
Getting from zero to a live financial report takes five steps, and you can later enhance the setup with automation.
Step 1 — Define Scope.
Create a budget, give it a name and time period, and select the Jira projects, Epics, or JQL filter that defines what work is inside the fence. Choose whether the budget cap is a fixed manual amount (a top-down approved number) or estimate-based (calculated automatically from Jira task estimates multiplied by rates).
Step 2 — Import and Configure Rates.
Add your team via bulk import from a Jira Group or an existing ActivityTimeline Team. Users default to the budget's base rates; individual rates can be set with inline editing before finalizing. Hourly rates tie cost to logged time. Monthly rates are better for salaried employees — a fixed monthly amount that is prorated automatically across active days, regardless of how many hours the person logs in Jira.
Step 3 — Add External Costs and Revenue.
Log any financial items that live outside Jira tickets — a vendor invoice, a fixed-price milestone payment, a recurring software subscription. Each transaction can begin from a Jira issue or a specific user for deeper reporting, and recurring transactions can be set to generate automatically at any interval.
Step 4 — Open the Summary Dashboard.
With scope, rates, and initial transactions in place, the dashboard populates automatically. Actual spend and revenue update as the team logs work in Jira. Jira Automation uses no-code rules to handle recurring tasks like budget approvals and procurement requests more efficiently, which supports smoother execution.
Step 5 — Configure Allocation Targets.
To enable the Budget vs. Spend report, define how you intend to distribute the total budget across categories, projects, or other dimensions. These manual targets become the "Budget" side of the comparison chart. Without them, the chart has no baseline to compare against.
{{rich-cta-1}}
Who This Is For
The Finances module is relevant across several common project structures.
Service agencies and consultancies use it primarily for profitability and budget tracking — comparing what they pay their team against what they bill clients, and monitoring whether billing rates are covering costs.
Internal departments (IT, marketing, operations) use it for strict cost control — delivering work without exceeding a predetermined budget approved by leadership, with no revenue tracking required. This improves focus and productivity by allowing teams to rely on connected tools instead of manual rollups. Accurate reporting also depends on strict Time Spent guidelines, with time logged consistently against the right Epics or Stories.
Product companies use it to understand the true cost of building and maintaining a product versus the income it generates, including both hourly effort and fixed recurring costs.
Fixed-price project managers use it to decouple hourly effort from revenue reporting, logging the contract amount as a single fixed revenue transaction while tracking internal labor costs separately to monitor margin.
Conclusion
Jira tracks work. ActivityTimeline Finances tracks what that work costs.
The Jira reporting for finance teams does not require a separate finance system or a manual reconciliation process. It reads the worklogs your team is already creating, applies the rate logic you configure once, and produces real-time financial reports that are accurate enough to share with stakeholders and detailed enough to use for invoicing.
For teams that already use ActivityTimeline for resource planning, the Finances module is a natural extension — turning the same schedule data that powers capacity planning into the cost and revenue visibility that finance teams and project managers both need.