Jira is the backbone of project management for thousands of teams worldwide — but if you’ve ever tried to get a clear, cross-project picture of your team’s performance from Jira’s native reports alone, you already know the frustration. Standard Jira reporting often falls short the moment your needs grow beyond a single project view.
This guide covers the best Jira reporting plugins available today, which are accessible through the Atlassian Marketplace, what each one does best, and how to choose the right tool for your team’s reporting needs. These plugins operate within the broader Atlassian ecosystem, supporting integration and advanced analytics for technical teams.
Introduction to Jira Reporting
Jira comes with a solid set of built-in reports: burndown charts, velocity reports, cumulative flow diagrams, sprint reports, and the velocity chart, which is a key tool for sprint tracking. For small teams working within a single project, these are often enough to get by. But as organizations scale — running multiple projects simultaneously, managing cross-functional teams, or reporting to stakeholders who need executive-level dashboards — those native capabilities start showing their limits. Tracking created issues and resolved issues across multiple projects is difficult with native tools, and Jira's built-in reporting is limited in how it visualizes and analyzes Jira issues, especially for cross-project or executive reporting.
Why Standard Jira Reporting Often Falls Short
Jira’s native reporting capabilities are limited to single-project views and basic tracking, making them insufficient for cross-project reporting or executive dashboards. Out of the box, you can’t easily:
- Aggregate data across multiple projects in a single view
- Track resource utilization and team capacity in real time
- Report on time spent vs. planned across a portfolio
- Build custom workflows or calculated fields without additional tooling
- Visualize trends across sprints, teams, or business units
- Track unresolved issues by priority or age across projects to identify bottlenecks and improve workflow
- Create customizable reports or custom reports for advanced analysis and tailored insights
In practice, teams end up exporting data to spreadsheets and stitching things together manually — which is time-consuming, error-prone, and doesn’t scale. That’s exactly where Jira reporting plugins, add-ons, and integrations step in.
When to Use Which Jira Apps and Add-Ons
Not every Jira reporting tool is built for the same job. Jira add ons and reporting add on options are available through the Atlassian Marketplace, offering a wide range of solutions to extend Jira’s core functionality. The right choice depends on your team’s specific reporting needs:
- Resource planning, time tracking, and budgeting → ActivityTimeline
- Advanced OLAP analytics and custom MDX calculations → eazyBI
- Quick visual dashboards without setup → Custom Charts for Jira
- Plain timesheet reporting → Reports and Timesheets for Jira
- Agile velocity and sprint performance → Agile Velocity Charts
- Lightweight, no-code reporting → Easy Reports
- SLA tracking for service teams → SLA Time and Reports
Popular marketplace apps and third party applications can further enhance Jira's reporting capabilities, enabling advanced data analysis, visualization, and comprehensive dashboards that go beyond native features.
With that map in mind, let’s dig into each tool.
#1. ActivityTimeline
ActivityTimeline is far more than a Jira reporting plugin — it’s a full resource and capacity management platform and dashboards app built natively for Jira Cloud, Jira Data Center, and Jira Service Management. ActivityTimeline offers seamless integration with Jira Cloud and Data Center, ensuring smooth compatibility and ease of use for Jira users.
While many reporting tools focus on surfacing historical data, ActivityTimeline gives project managers a live, forward-looking view of their team’s capacity, availability, and workload — all within Jira. Its dashboard features enable teams to consolidate multiple projects or metrics in one dashboard, providing a unified, comprehensive view for efficient monitoring and management.
Planning Dashboard
Think of ActivityTimeline’s planning dashboard as your mission control. It provides interactive dashboards for real-time workload and capacity visualization, offering a crystal-clear, cross-project view of every team member’s workload in a single timeline interface. You can see who’s working on what, when they’re available, and whether any team member is over- or under-utilized — all without switching between multiple Jira projects or dashboards.
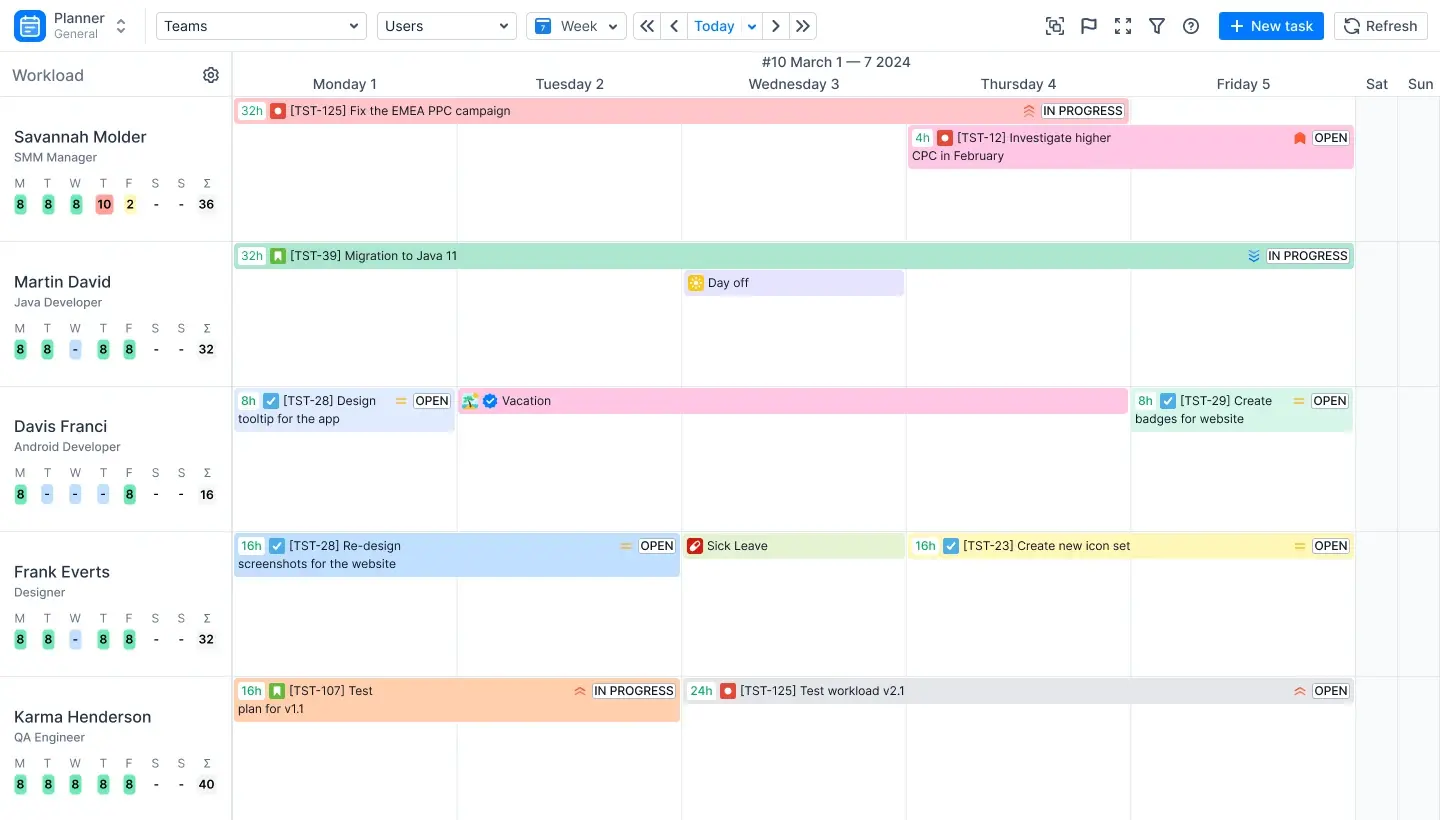
The planner integrates seamlessly with Jira Software, Jira Service Management, and Jira Service Desk, keeping everything in sync automatically. It also connects with Jira Plans (formerly Advanced Roadmaps) and Tempo, making migration from existing workflows easier than ever.
Reporting Capabilities
ActivityTimeline’s reporting suite is where it truly differentiates itself. Rather than offering a generic set of charts, it enables users to build reports tailored to their needs, providing targeted, role-specific reports that speak directly to the questions project managers and team leads ask every day.
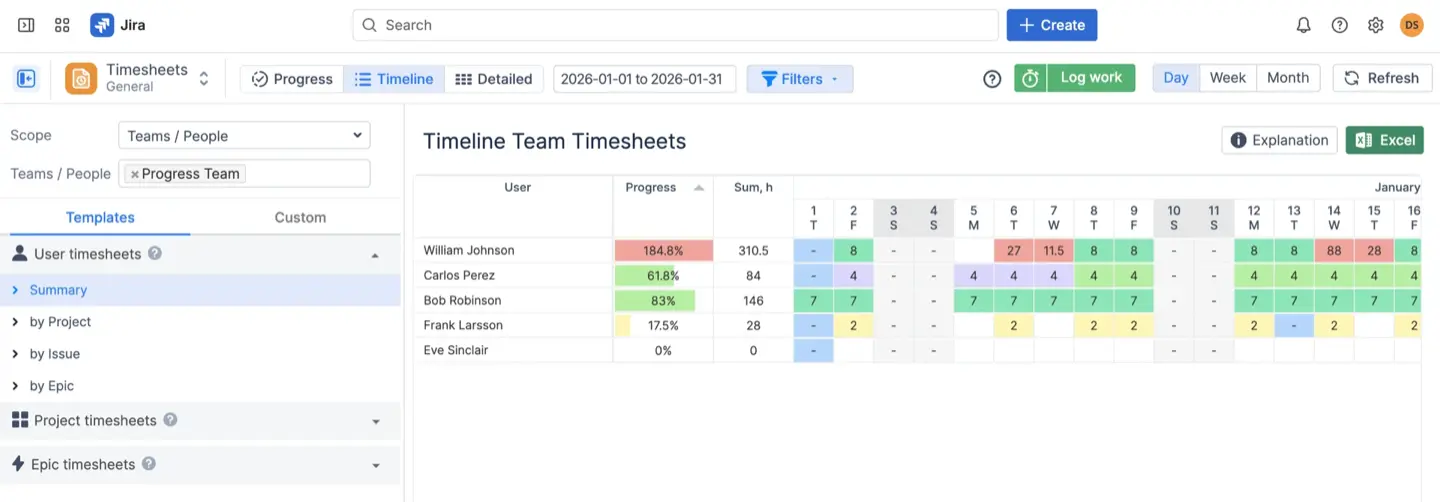
Timesheet Reporting
ActivityTimeline offers three types of customizable timesheet reports:
- Progress Timesheets — Compare logged hours to required work hours. A built-in progress bar tracks non-working days and shows how close the team is to meeting goals.
- Team Timesheets — Choose from templates to see summaries or dig deeper into data grouped by project, issue, epic, or custom Jira fields.
- Detailed Timesheets — Add custom Jira fields to track every angle of task, project, or user performance at a granular level.
Users can create custom reports and highly customizable reports for advanced analysis, adjusting filters and dimensions as needed.
Building these reports is straightforward — pick your values, generate the report, and export as needed.
Resource Reports and Charts
Resource reports track who’s working on what, using Jira’s remaining time estimates to calculate workloads and capacity. They’re purpose-built for spotting under- and over-utilization before it becomes a problem. Key resource reports include:
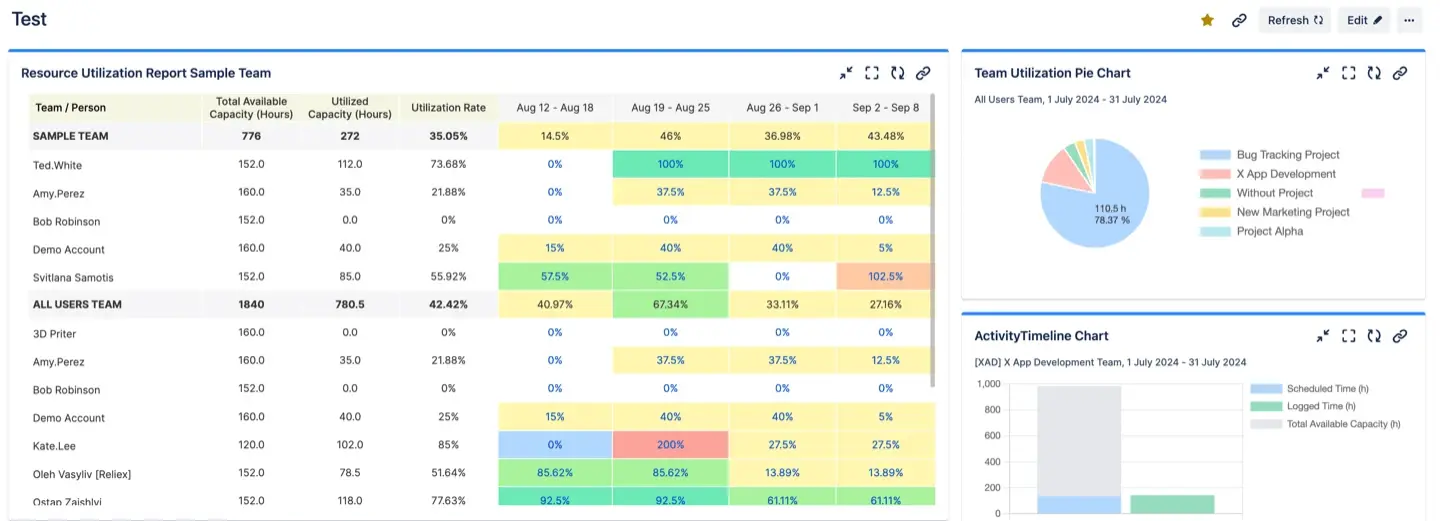
- Team Utilization Pie Chart — A quick visual of how workload is distributed across the team
- Capacity and Availability Reports/Forecasts — Available at the team, individual, and skills level, so you can plan future sprints with confidence
- Detailed Worklog Reports — Deep-dive into time spent across any combination of projects, users, or custom fields

Reports can be viewed as Excel exports, exported in various formats such as Excel and XML, or accessed directly in-app as web reports.
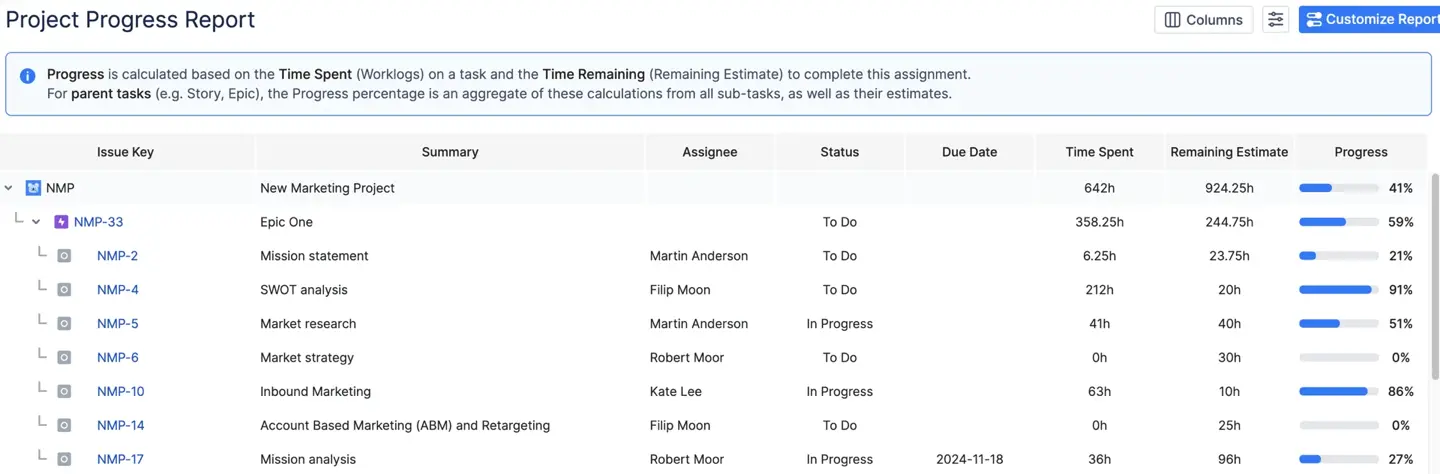
Project Reports and Charts
Project reports pull live Jira data to show progress against goals at the project, epic, or initiative level:
- Planned vs. Actual Report and Chart — See how estimated effort lines up against what was actually logged
- Project Progress Reports — Track completion percentages and identify bottlenecks in real time
Leave and Event Reports
ActivityTimeline handles leave management alongside project reporting, giving managers a unified picture of team availability:
- Leave Report — Who’s out and when, across the entire team
- Vacations Report — Vacation statuses by user for planning purposes
Jira Dashboard Integration
ActivityTimeline’s reports can be added as Jira gadgets directly to your Jira dashboards. Team capacity charts, planned vs. actual charts, and utilization pie charts all appear natively in Jira’s dashboard interface. Built-in caching means reports only refresh when needed (or on auto-refresh intervals you configure), keeping performance smooth even for large teams.
Bookmarked Reports
For teams that run the same reports regularly, ActivityTimeline’s Bookmarked Reports feature saves configured reports as shortcuts. One click brings up the exact report, pre-configured, saving time on every reporting cycle.
Custom Reporting and Export
When built-in reports aren’t quite the right fit, ActivityTimeline supports custom grouping by story points, fix version, or any custom Jira field. Data exports to Excel and other various formats let teams go deeper — tracking trends, sharing with stakeholders outside Jira, or combining with data from multiple data sources, including external sources.
Verdict: Why ActivityTimeline Stands Out
Most Jira reporting plugins answer the question “what happened?” ActivityTimeline also answers “what’s coming?” — making it uniquely valuable for resource planning, sprint forecasting, and capacity management. It combines the depth of a dedicated reporting tool with the forward-looking power of a resource planner, all without leaving your Jira instance. High-level visibility across portfolios and dependency tracking across teams are essential for effective project management, and ActivityTimeline supports these needs.
#2. eazyBI
eazyBI for Jira is a leading BI tool and reporting add on within the Atlassian ecosystem, providing advanced analytics and data visualization capabilities for Jira users. As one of the most advanced Jira add ons for reporting, eazyBI enables users to create highly customizable reports and custom reports—known as eazyBI reports—that support complex data analysis, including custom MDX calculations and tailored dashboards. eazyBI can connect to multiple data sources, such as SQL databases and REST APIs, for comprehensive and dynamic reporting. While eazyBI offers unmatched flexibility for technical teams needing detailed, custom reporting, it requires significant setup and expertise. In contrast, Report Hub is designed for teams that want prebuilt reports immediately, requiring no setup or coding, making it a faster solution for out-of-the-box reporting needs.
Reporting Capabilities
eazyBI allows users to build reports—including custom reports and highly customizable reports—on Jira issues such as created issues and resolved issues, as well as other project metrics. Users can analyze, filter, and visualize data from Jira issues, tracking trends like created versus resolved issues, cycle times, and more. eazyBI reports can be exported in various formats for sharing and analysis, such as Excel or XML.

The platform enables connection to multiple data sources, including external sources like SQL databases and REST APIs, allowing users to consolidate and analyze data from across the organization. eazyBI supports interactive dashboards, letting teams combine multiple reports and charts into one dashboard for a unified, dynamic overview.
eazyBI also supports Gantt charts, roadmaps, and hybrid Agile/Waterfall methodologies, making it suitable for enterprise-grade project management and advanced planning needs.
The platform features a powerful MDX formula editor that enables users to create custom calculations and reports, enhancing the depth of data analysis. MDX (MultiDimensional Expressions) formulas are borrowed from the world of enterprise BI, supporting complex multi-dimensional analytics that go far beyond what standard Jira reports can produce. eazyBI is recognized for its advanced OLAP-style analytics and custom calculations, making it suitable for teams that require multi-dimensional analytics and have the expertise to use MDX for complex queries.
eazyBI supports a wide range of chart types and filters, enabling teams to visualize complex data from multiple angles. Reports and dashboards can be shared with specific Jira users and groups, published through Confluence, distributed via email, or embedded in external websites — with granular user access rights controlling who sees what.
Teams that want prebuilt reports immediately with no setup or coding will find eazyBI’s learning curve steep. Many teams find that tools requiring extensive MDX training are less likely to be adopted compared to tools that work out of the box. For teams with dedicated BI expertise, however, eazyBI is exceptionally powerful.
Best for: It’s a super powerful app, but is focused on general BI analytics, and is a an amazing alternative to a more complex and much more expensive Power BI by Microsoft. Teams that need enterprise-grade, multi-dimensional analytics and have the technical capacity to invest time in custom MDX calculations and initial configuration.
#3. Custom Charts for Jira (by Tempo)
Custom Charts for Jira by Tempo is a dashboards app and one of the most popular marketplace apps for Jira. As a Jira add-on, it offers seamless integration with Jira, allowing teams to easily create custom reports and highly customizable reports using its intuitive drag-and-drop builder. Key features include multiple chart types and instant setup, making it one of the most accessible Jira reporting solutions available.
Reporting Capabilities
Custom Charts enables users to build reports and interactive dashboards on Jira issues, allowing teams to track created issues, resolved issues, and unresolved issues for comprehensive project monitoring. It connects directly to your Jira data and renders charts as Jira gadgets, so reports live right where your team already works. It supports rich filters, multiple chart types (bar, pie, line, table), and grouping by common Jira fields including status transitions, assignee, priority, and custom fields. Sub-tasks and linked issues can be included in report logic, giving teams a more complete picture of work in progress.

The tool is particularly well-suited for teams that need visually clean, shareable dashboards without writing a single line of code or learning a query language. Configuration is fast, and reports update automatically as Jira data changes.
Best for: Teams that want instant, visually polished dashboards from Jira data with minimal setup time.
#4. Reports and Timesheets for Jira (by Appfire)
Reports and Timesheets for Jira by Appfire is a Jira add-on and reporting add-on designed for time tracking and billing within Jira. It integrates with Tempo Timesheets for advanced time tracking, approval workflows for logged time, and accurate cost reporting—making it a strong choice for service-based teams managing billable hours.
Reporting Capabilities
The tool enables users to build reports and custom reports on Jira issues, including tracking created issues and resolved issues for comprehensive project analysis. Its reporting centers on time spent: how many hours were logged, by whom, against which issues, and how that compares to estimates. Customizable reports for time tracking allow teams to tailor insights to their needs, such as monitoring estimated hours, actual hours spent, and remaining hours to ensure projects meet deadlines and budgets — and this plugin delivers on all three. Reports can be exported in various formats for further analysis and sharing.

Timesheet reports can be filtered by user, project, issue type, or date range, and approval workflows add a layer of accountability that’s especially valuable for client-facing teams. The tool also supports reporting across multiple Jira instances, which is useful for organizations running parallel Jira environments.
Accurate logging and reporting on effort are crucial for service-based teams managing billable hours, and this plugin is purpose-built for exactly that use case. It lacks the resource planning and capacity forecasting features of ActivityTimeline, but for teams whose primary reporting need is time and billing, it covers the essentials well.
Best for: Service-based teams, agencies, and consultancies that need accurate time tracking, billing reports, and timesheet approval workflows in Jira.
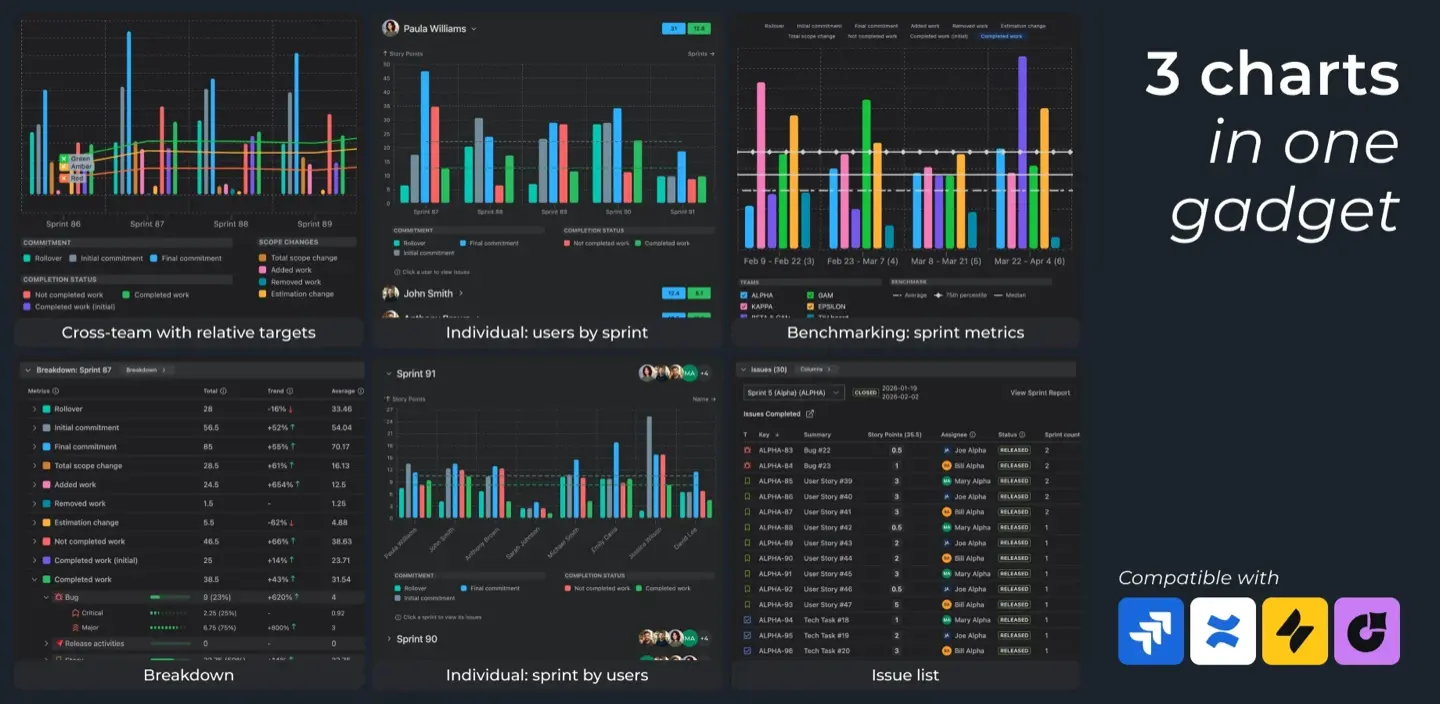
#5. Agile Velocity Charts (by BrokenBuild)
Agile Velocity Charts by BrokenBuild is a focused Jira reporting plugin and dashboards app that extends Jira's built-in velocity chart capabilities. As a Jira add-on and reporting add-on, it enables agile teams to create interactive dashboards for agile metrics, providing deeper visibility into sprint performance and team velocity—the metrics that matter most for sprint planning and predictability.
Reporting Capabilities
Agile Velocity Charts enables users to build reports and custom reports on Jira issues, including tracking created issues, resolved issues, and unresolved issues. The plugin offers customizable reports for agile metrics, extending Jira’s native velocity reporting with more chart types, richer filtering, and historical trend analysis. Teams can track story points completed per sprint, compare velocity across multiple sprints, and identify patterns in team performance over time. Charts render as Jira dashboard gadgets, so they slot naturally into existing Jira dashboards without disrupting workflows.
Agile Velocity Charts is narrow in scope by design — it doesn’t attempt to replace a full reporting suite or BI platform. But for agile teams that live and die by velocity data, it adds meaningful depth that Jira’s built-in reports don’t provide.
Best for: Scrum and Kanban teams that need richer velocity reporting and sprint analytics beyond Jira’s native capabilities.
#6. Easy Reports (by Bloompeak)
Easy Reports by Bloompeak lives up to its name — as one of the popular marketplace apps, this Jira add-on serves as a reporting add-on designed for teams that need reporting to just work, without configuration overhead or technical complexity. It offers seamless integration with Jira, making it easy to enhance your project management and data analysis capabilities.
Reporting Capabilities
Easy Reports enables users to build reports and custom reports on Jira issues, including tracking created issues, resolved issues, and unresolved issues. The platform provides a library of prebuilt report templates covering common Jira use cases: issue status summaries, workload distribution, sprint progress, and more. Reports are highly customizable, allowing users to tailor data views and visualizations to their needs. Reports can be published to Confluence pages, making them easy to share with stakeholders who don’t have Jira access.
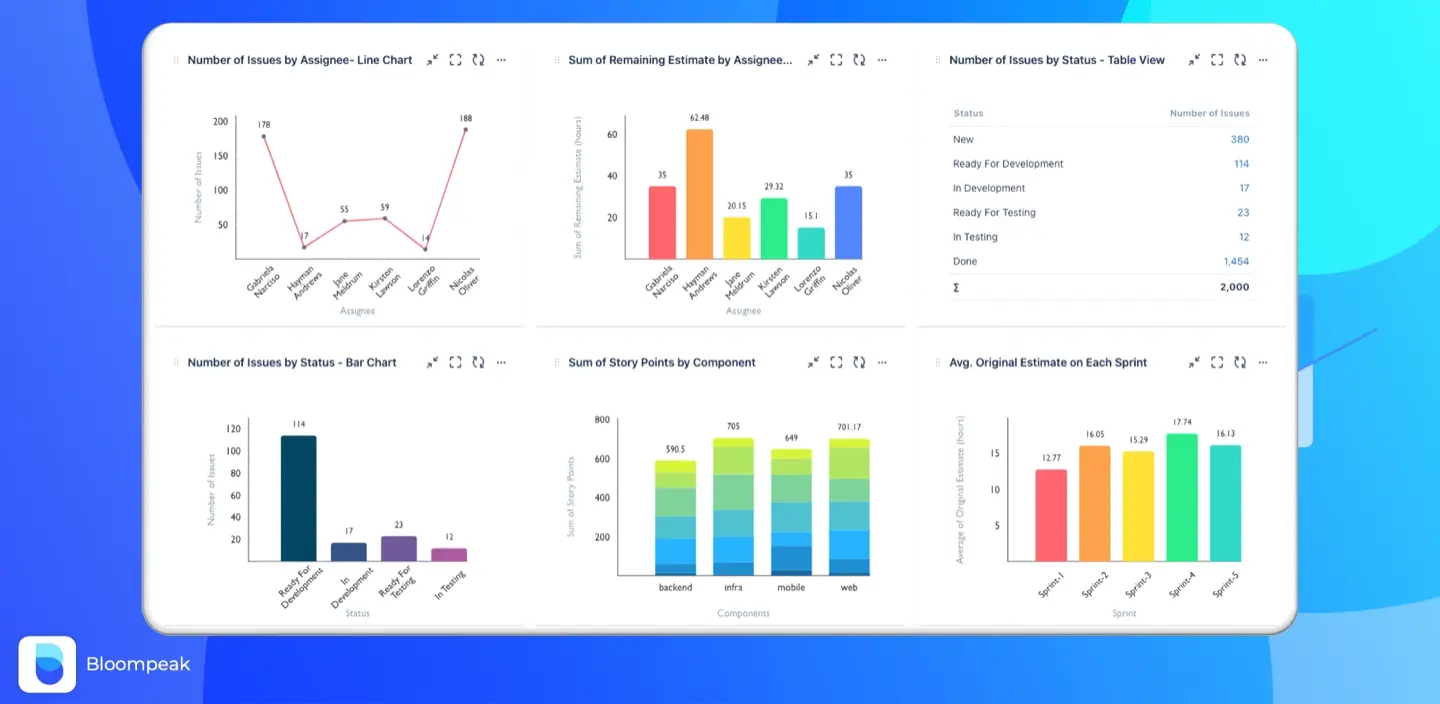
Easy Reports charts options
Easy Reports also supports exporting customizable reports in various formats, such as Excel and XML, for flexible data sharing and analysis. The tool supports custom fields and multiple chart types, giving teams enough flexibility to cover most reporting needs without requiring groovy scripts or technical setup.
For teams that want prebuilt reports immediately, requiring no setup or coding, Easy Reports is one of the fastest paths from zero to a working Jira reporting setup. It trades the advanced flexibility of tools like eazyBI for simplicity and speed.
Best for: Small teams or non-technical users who need quick, shareable reports from Jira with minimal configuration.
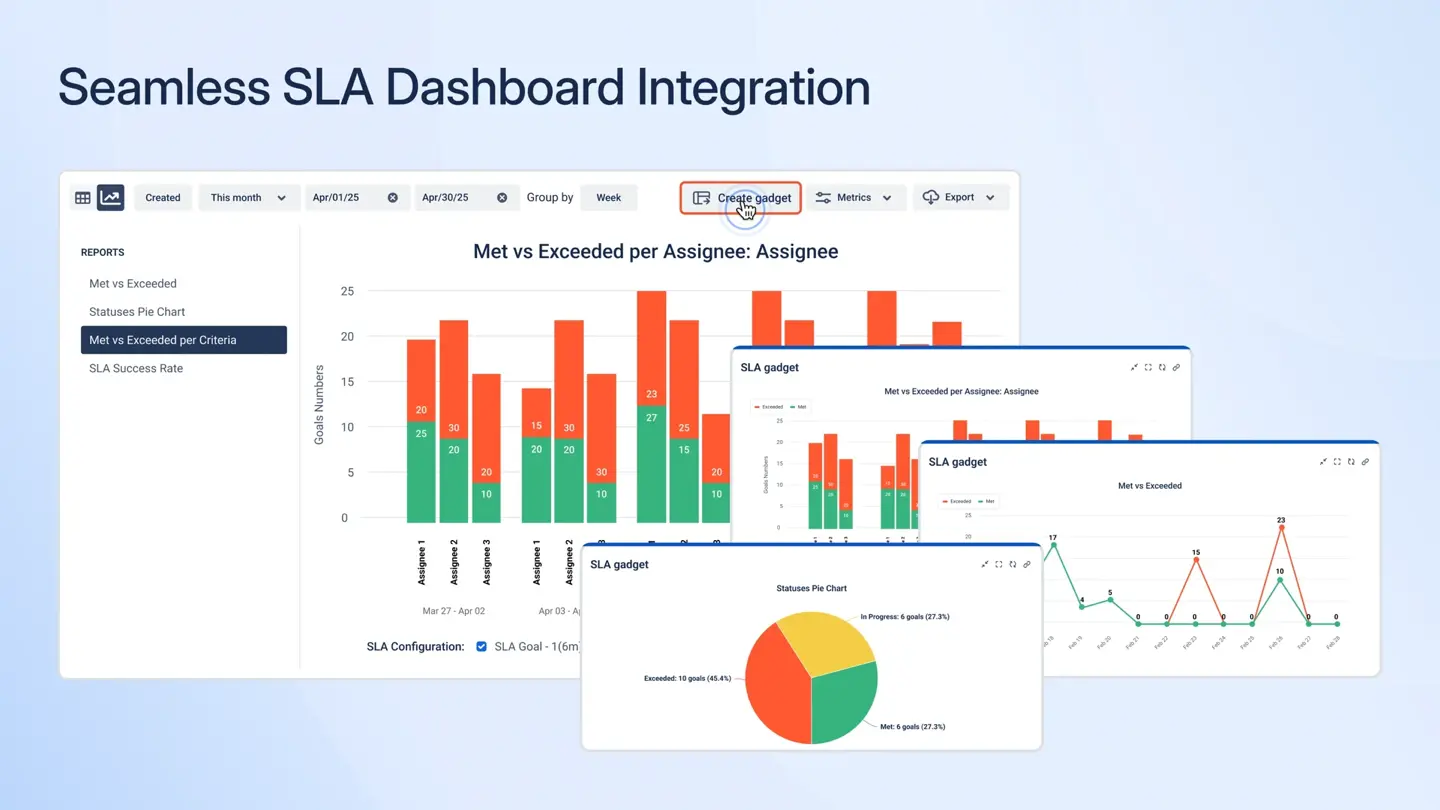
#7. SLA Time and Reports (by SaaSJet)
SLA Time and Reports by SaaSJet is a Jira add-on for reporting designed for Jira Service Management and Jira Service Desk teams that need to track, manage, and report on service level agreements. It offers seamless integration with Jira, supporting customizable reports and custom reports for SLA tracking, enabling tailored insights and flexible data analysis to meet specific project or business needs.
Reporting Capabilities
The plugin enables teams to build reports on Jira issues, including tracking created issues, resolved issues, and unresolved issues, as well as define custom SLA rules and track time-to-resolution and first-response times across issues. Users can generate detailed SLA compliance reports and export them in various formats for flexible data sharing and analysis. Alerts can be configured to fire before SLA breaches occur, giving service teams the chance to intervene proactively. Reports can be filtered by project, issue type, assignee, or custom fields.
For teams running service management workflows, high-level visibility into SLA performance across portfolios is essential — and SaaSJet’s plugin provides exactly that. It fills a gap that both Jira’s native SLA reporting (limited to basic dashboards) and general-purpose Jira reporting tools leave open.
Best for: IT service management and customer support teams running Jira Service Management who need structured SLA tracking and compliance reporting.
BI Tools Integrations
For organizations with mature data infrastructure, integrating Jira with a BI tool such as Power BI, Tableau, or Looker enables combining data from multiple data sources and third party applications. This approach allows teams to build reports, including custom reports and highly customizable reports, that go beyond the capabilities of Jira-native reporting tools.
Business intelligence tools for Jira can blend data from various external sources — CRM data, financial systems, HR platforms, and more — combining it with Jira data to produce cross-functional analytics that no single plugin can replicate. These BI tools also support exporting reports in various formats (such as Excel, XML, and others) and enable the creation of interactive dashboards for dynamic, real-time data visualization and decision-making. Common integration patterns include:
- Power BI + Jira: Using the Jira REST API or a dedicated connector to pull issue data, worklogs, and custom fields into Power BI models for executive dashboards and trend analysis
- Tableau + Jira: Building interactive visualizations that layer Jira project data alongside business metrics for portfolio reporting
- Looker + Jira: Creating governed, reusable data models from Jira data that business teams can self-serve
The trade-off is significant engineering investment. BI integrations require data pipelines, maintenance, and technical expertise to build and sustain. They make the most sense for large organizations where Jira data is one input into a broader data strategy, rather than the primary reporting surface. For most teams, a purpose-built Jira reporting plugin delivers better results faster — and with far less overhead.
Conclusion
Jira’s native reporting is a starting point, not a finish line. As your team grows and your projects multiply, the Atlassian Marketplace offers a wide range of Jira add ons and reporting add on options to enhance your reporting capabilities. Choosing the right Jira reporting plugin can make the difference between flying blind and having genuine, actionable visibility into your team’s work.
The best dashboards app or reporting tool depends on your specific needs and how it fits within the broader Atlassian ecosystem:
- For resource planning, capacity management, and timesheet reporting, ActivityTimeline provides the most comprehensive solution — combining forward-looking planning with deep reporting, all natively within Jira.
- For advanced OLAP analytics with custom MDX calculations, eazyBI is the most powerful option for teams with the technical expertise to use it, and it leverages the strengths and limitations of the Atlassian ecosystem for technical teams.
- For instant visual dashboards, Custom Charts for Jira is a dashboards app that gets you up and running with no setup, offering seamless integration and customizable charts.
- For time tracking and billing, Reports and Timesheets for Jira handles the specifics of billable hour reporting.
- For agile velocity tracking, Agile Velocity Charts adds depth to sprint performance data.
- For lightweight, no-code reporting, Easy Reports is the fastest path to shareable Jira reports.
- For SLA compliance in service management, SLA Time and Reports covers what other tools miss.
Popular marketplace apps with seamless integration are essential for Jira users who want to enhance data analysis, visualization, and report building. These Jira add-ons and dashboards apps can integrate various data sources and provide user-friendly interfaces, making them valuable additions to your reporting toolkit.
No single tool is the best Jira reporting tool for every team. But if you need a solution that covers resource planning, capacity forecasting, timesheet reporting, and cross-project visibility in a single, well-integrated package, ActivityTimeline is worth a close look.
{{rich-cta-5}}