BlogFeatures
The True Cost of “Free” Planning in Excel: How Much You’re Paying for It Every Day

The True Cost of “Free” Planning in Excel: How Much You’re Paying for It Every Day

Studies show teams lose about 9 hours per week copying and pasting data between spreadsheets and systems. That’s where ActivityTimeline steps in.

November 4, 2025
0
min read
The True Cost of “Free” Planning in Excel: How Much You’re Paying for It Every Day
Daria Spizheva | ActivityTimeline's Blog Author
Daria Spizheva
Content Marketing Manager
In this article

It’s 9 a.m. You’re staring at an Excel sheet that looks like a flight control dashboard—tabs, filters, color-coded cells, and that one formula that broke again. You tell yourself it’s fine; Excel’s flexible, everyone uses it, and hey, it’s free.

But here’s the uncomfortable truth: that “free” spreadsheet is probably one of the most expensive tools in your workflow.

Not because of its license fee, but because of what it costs you in time, accuracy, and sanity.

The Spreadsheet Tax: The Hidden Costs of Excel Planning

1. The Cost of Wasted Hours

If you’ve ever spent your Friday afternoon updating project timelines in Excel, you’ve already paid the price.

Manual data entry eats your week in invisible chunks. Studies show teams lose about 9 hours per week copying and pasting data between spreadsheets and systems. Multiply that by 10 people, and you’ve just lost a whole workday—every single week.

Think about it: how many hours have you spent chasing the “latest” version of a planning file, or rechecking whether the totals in column N actually match Jira’s real numbers?

That’s not productivity. That’s unpaid spreadsheet labor.

2. The Cost of Critical Errors

We’ve all been there. Someone updates one formula. Another person sorts the column incorrectly. Suddenly your capacity plan says a developer has -8 hours available next week.

You laugh—until you realize a client delivery slipped because of it. It’s not rare: about 88% of spreadsheets contain errors. A misplaced formula once cost a construction firm $3.7 million in a single bid. Your loss may not be that dramatic, but if a bad cell can derail your timeline, your “planning tool” isn’t doing its job, it’s doing damage control.

3. The Cost of Zero Visibility

Spreadsheets don’t tell you who’s actually available. They tell you who was available when you last updated the file.

You know the dance: someone’s on vacation, someone else is double-booked, and you discover it after a sprint starts. No matter how many filters or Gantt charts you build, Excel can’t show you real-time capacity. It’s static. Out of sync the second you close it.

In fast-moving teams, that lack of visibility costs opportunities. You might miss that one designer who could’ve helped unblock a launch, or realize too late that a backend dev was booked solid for the month. Every blind spot adds friction and friction kills momentum.

4. The Cost of Team Frustration

Nobody joins a tech company to babysit Excel.

But when your “planning system” is a file buried in Slack threads and email attachments, that’s what happens.

People stop trusting the plan. They stop updating it. Meetings turn into status therapy sessions: “Wait, which file are we using again?”

Over time, the burnout is real. Studies link repetitive data work to higher stress and lower engagement. One report found that 56% of employees feel drained by manual data entry. The best people—the ones who want to build, design, lead—don’t want to wrestle spreadsheets. They leave, and you’re left patching the system again.

Cost Breakdown — Excel-as-Planning-Tool

Cost Category Metric/Typical Range Example calculation (10-person team/1 year) Financial impact estimate (USD/year) Key assumptions & sources How Activity Timeline directly mitigates this
1.Wasted hours (manual updates, copy/paste, reconciling) Typical: ~9 hours/week per person spent on manual data tasks (varies by role). (parseur.com) 9 hr/week × 52 = 468 hr/yr per person → 468 × $50/hr assumption = $23,400/yr per person. For 10 people = $234,000/yr. Alternatively use Parseur figure $28,500/yr per person (automation study). (parseur.com) Conservative calc: $234k/yr (10 ppl @ $50/h). Parseur-based: $285k/yr (10 ppl × $28.5k). Assumption: median fully-loaded labor rate = $50/hr (adjustable). Data on hours & annual cost from Parseur, Smartsheet/ProcessMaker (surveys/analyses).(parseur.com) Real-time Jira sync + planner removes copy / paste and repeated exports; updating issues in Jira auto-updates timelines — saves manual update hours and eliminates repeated exports/pivots
2.Critical errors (formula mistakes, broken links, bad sorts) ~90–94% of operational spreadsheets contain errors; average cell/formula error rates reported in meta-studies.(mba.tuck.dartmouth.edu) Example: if 1 major error per year causes a project delay/rework costing $50k (conservative for mid-sized project). For 10 ppl org with several plans, 1–3 incidents plausible → $50k–$150k/yr in direct costs + reputational/contract risk. Real-world extreme examples reach millions (emblematic case: $3.7M)(Caspio) Estimated: $50k–$150k/yr (conservative). Large outliers possible (examples show multi-million losses). Source: field audits and surveys plus documented spreadsheet disasters (industry reporting). Error prevalence: Dartmouth/Panko/Frontiers / industry summaries. (mba.tuck.dartmouth.edu) Activity Timeline removes manual aggregation and replaces fragile formulas with governed, live Jira data. Fewer manual transforms → far lower chance of a “bad cell” cascading into a bid error or missed deadline.
3.Zero / delayed visibility (missed reallocation, late discovery of bottlenecks) Time-to-insight: spreadsheets are static; by the time data is reconciled, it’s stale. Surveys show workers spend large portions of week on data tasks and re-creating documents when they can’t find current info.(smartsheet.com) Example impact: 1 delayed feature launch per year due to mis-allocated resources → lost opportunity / time-to-market cost conservatively $75k–$250k (depends on product). Add cost of firefighting meetings: 4 extra manager-days/month ≈ 48 manager-days/yr ≈ 384 hrs → at $100/hr manager fully loaded ≈ $38k/yr. Estimated: $100k–$300k/yr (varies by product/revenue sensitivity). Sources: Smartsheet, ProcessMaker analyses on repetitive tasks/time lost and the need for single source of truth. Assumptions: product launch value / manager hourly rate are organization-specific. (smartsheet.com) Activity Timeline provides live capacity / workload dashboards and forecast reports, enabling immediate reallocation and accurate “who-can-help-now” decisions — reducing reactive firefighting and lost time-to-market.
4.Team frustration & turnover (spreadsheet fatigue, burnout) ~56% employees report burnout from repetitive data tasks (survey). Burnout raises attrition and reduces productivity.(parseur.com) Example: if one mid-level engineer (total comp $120k) leaves per year due to frustrations and recruiting/ ramp costs = 50–100% of annual comp → $60k–$120k replacement cost. Hiring + lost ramp = conservative $80k. Estimated: $80k–$200k/yr per lost high-value hire (depending on role & number of departures). Source: Parseur and industry HR studies on manual task burnout and attrition drivers; assumptions on replacement costs consistent with standard HR estimates. (parseur.com) Activity Timeline reduces repetitive admin work and increases trust in planning. Less spreadsheet babysitting → higher job satisfaction and lower churn risk.
Total (example 10-person team — combined conservative estimate) Sum of above Wasted hours: $234k (conservative) + Errors: $50k + Visibility: $100k + Turnover: $80k = $464k/yr (conservative) Range: $300k–$1,000k+ / year for a 10-person org depending on assumptions and frequency/severity of errors and turnover. Use Parseur per-person figure for higher-bound estimates.(parseur.com) Assumptions shown per row. Use org-specific hourly rates, number of projects, and employee churn to calibrate. Replacing the spreadsheet layer with Activity Timeline typically avoids much of the wasted labor, reduces error exposure, shortens time-to-insight and lowers churn risk - producing immediate, defensible ROI.

{{rich-cta-1}}

How ActivityTimeline Fixes It

You already have Jira. What you’re missing is the layer that makes it truly visual and usable for planning. That’s where ActivityTimeline steps in.

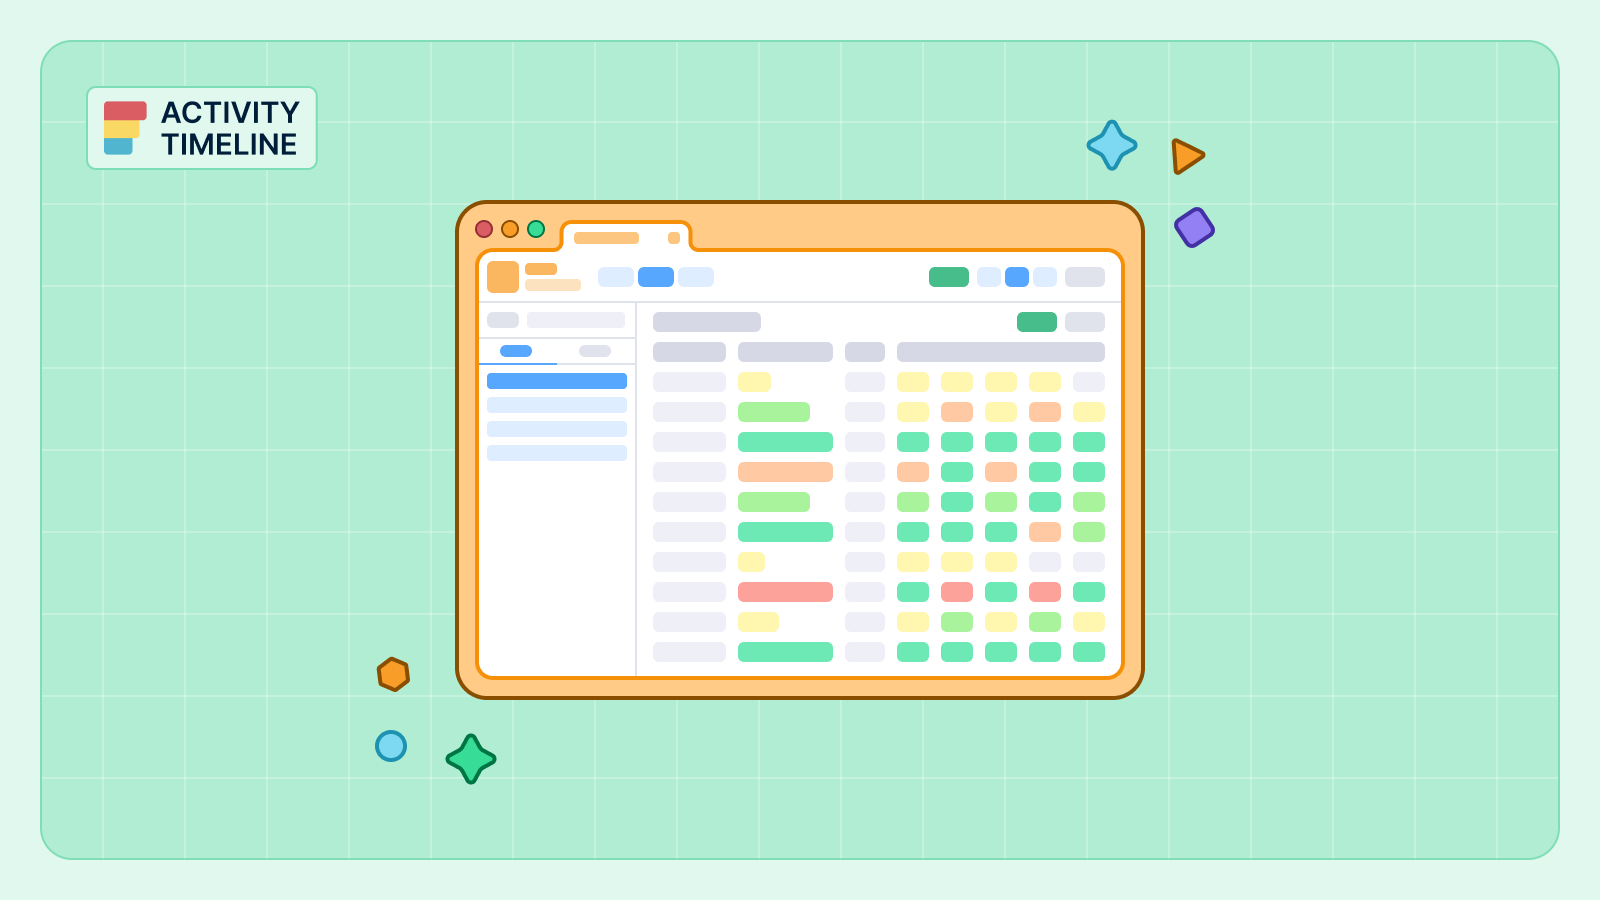
Instead of Manual Data Entry…

Every task from Jira shows up on a shared, visual timeline. You can drag, drop, and plan directly in Jira. No export. No sync lag. The data updates itself every few minutes. You focus on the work, not the wiring.

Timeline view in ActivityTimeline

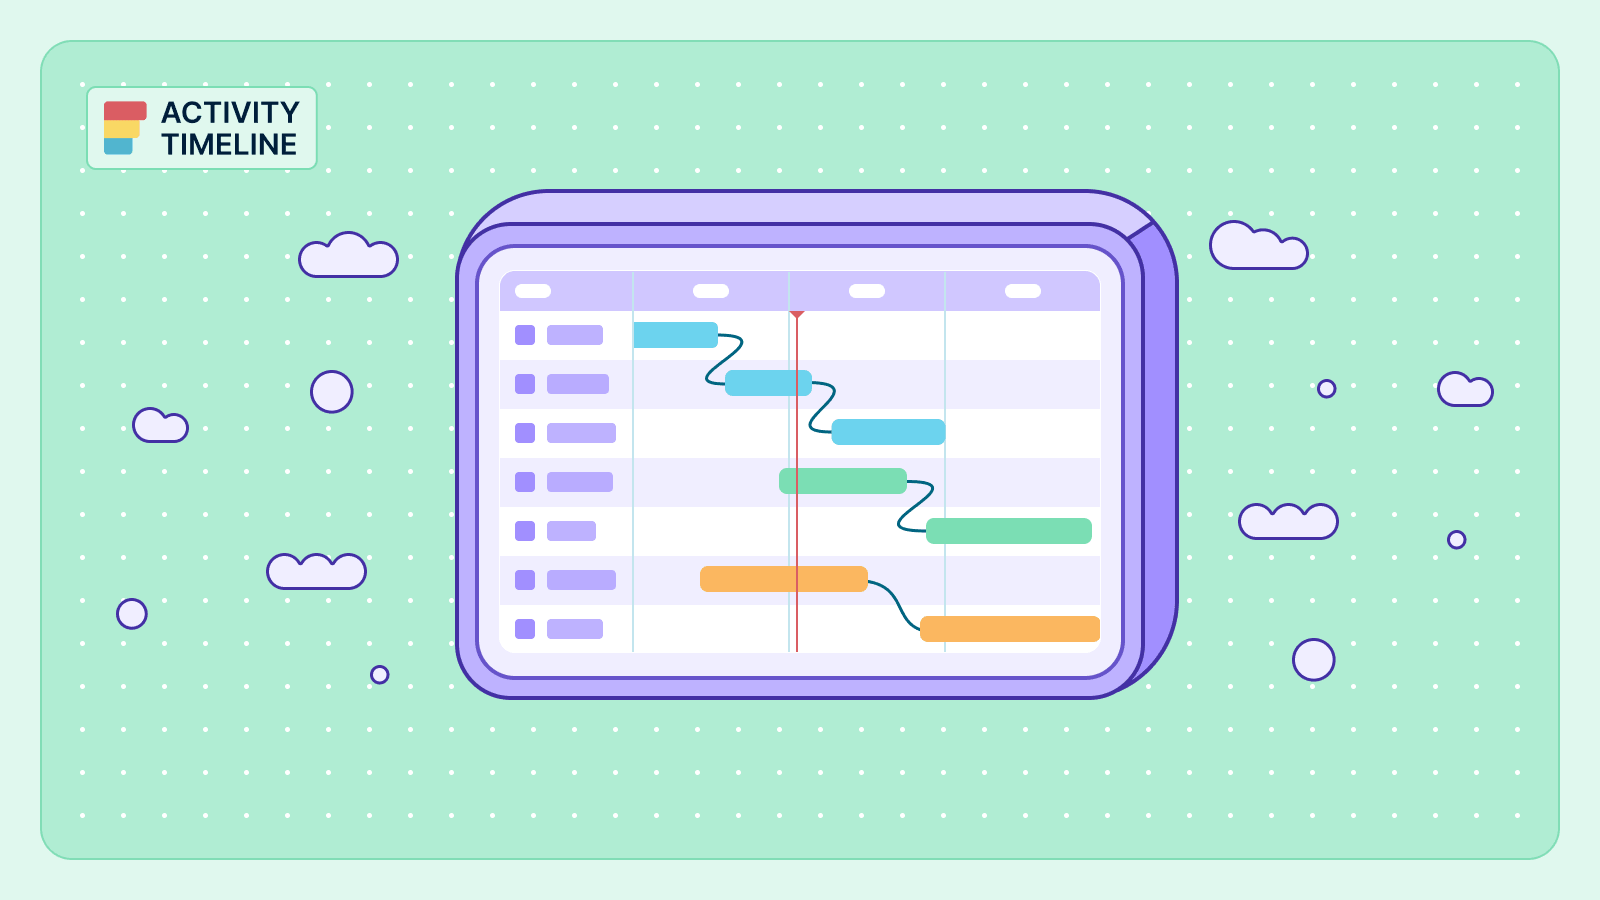
Instead of Version Control Hell…

ActivityTimeline becomes your single source of truth. Everyone sees the same plan, live. No “final_v3_reallyfinal.xlsx.” If a task moves, everyone knows.

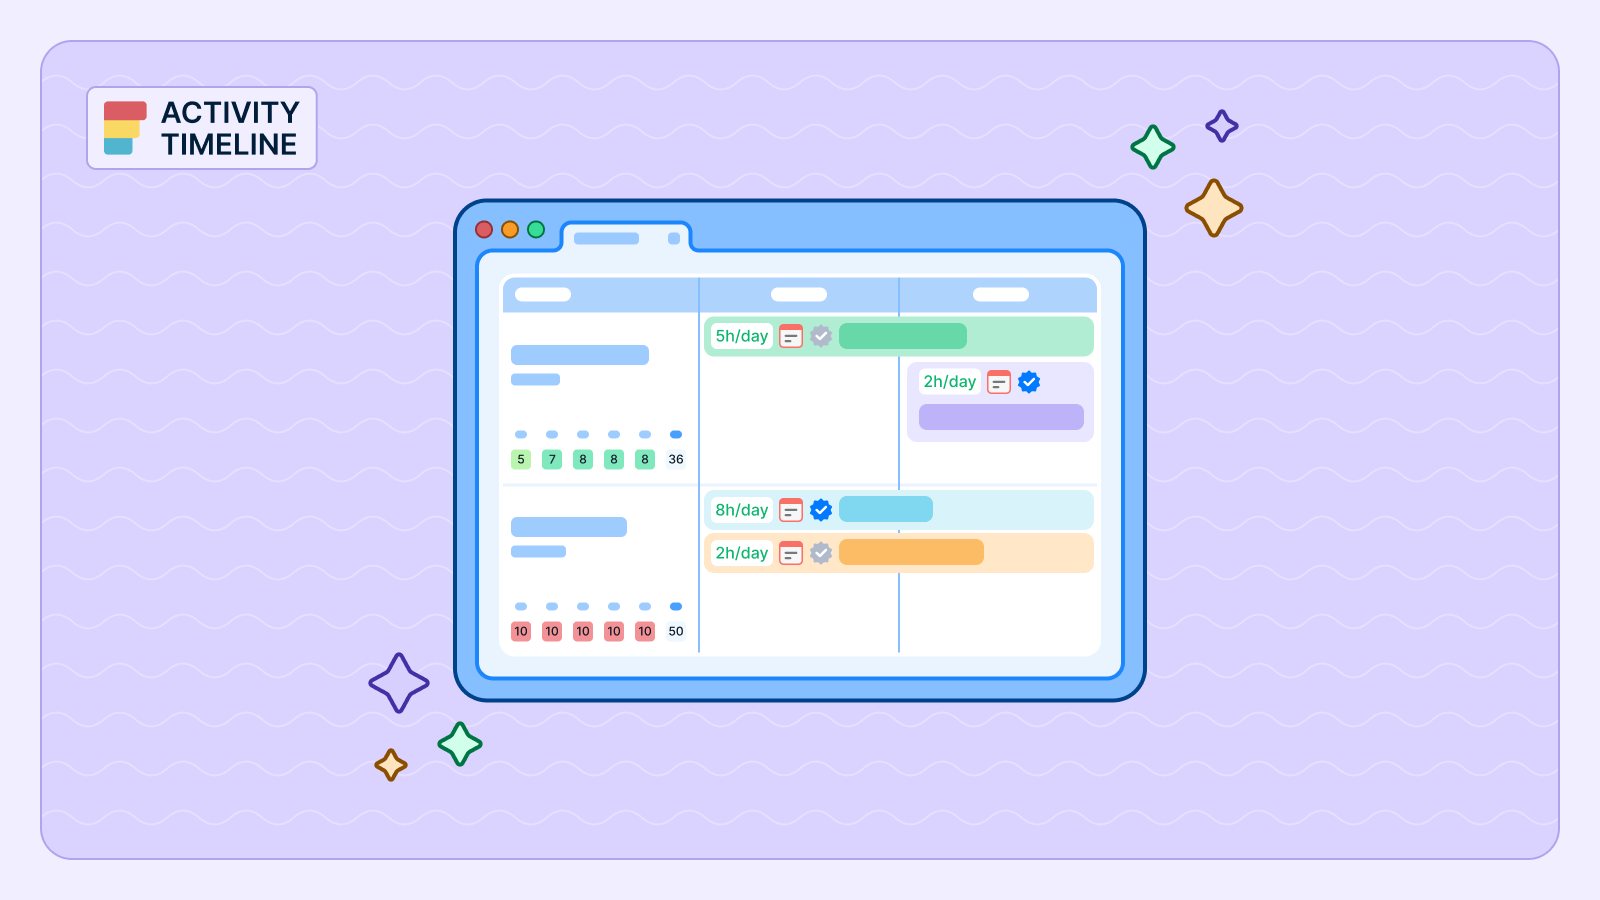
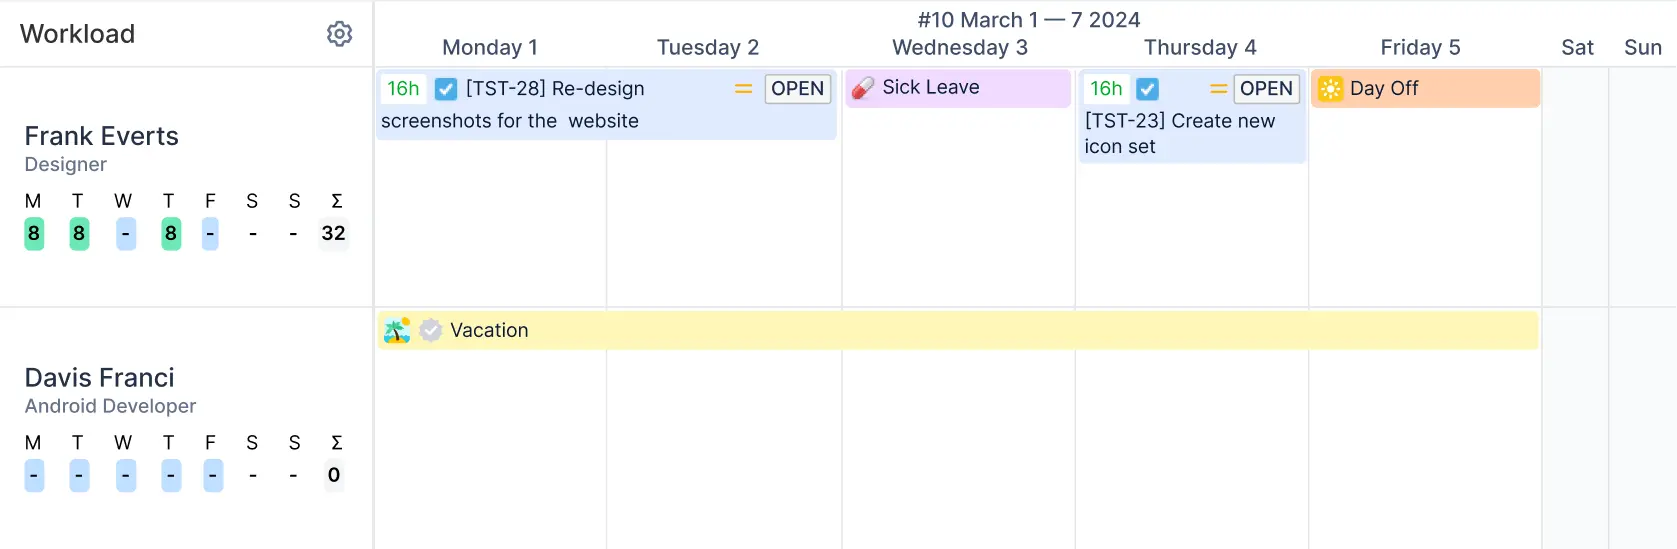
Instead of No Visibility…

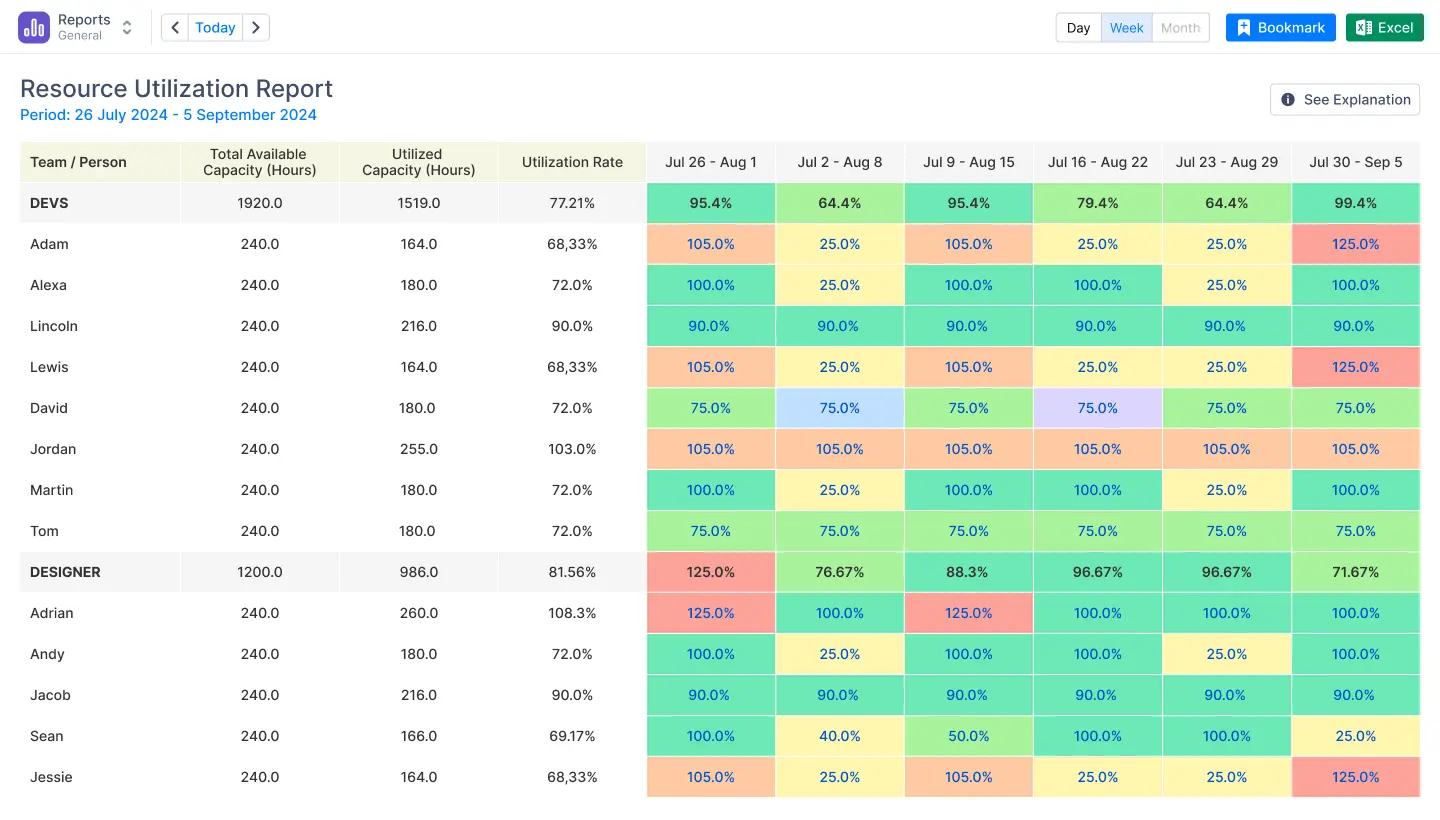
You get live workload and capacity dashboards. Who’s overbooked? Who’s free next week? The system highlights it instantly—red for overloaded, green for good. You can forecast capacity weeks ahead, for a specific person or across multiple teams, without opening a single tab.

Personal workload breakdown in the Work module

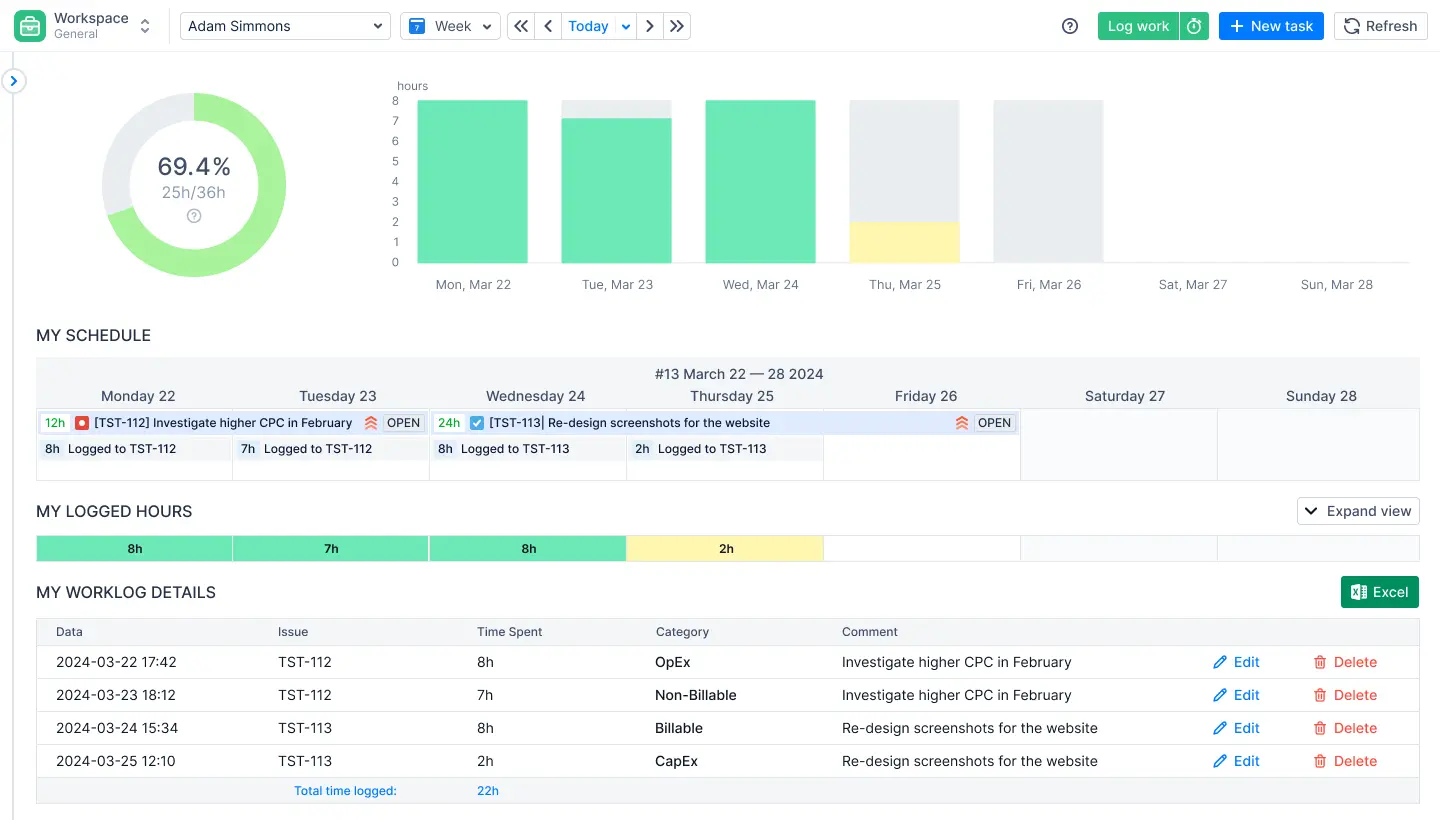
Instead of Inaccurate Reports…

Reports build themselves from real Jira data. Planned vs. Actual hours, time tracking per project, team utilization are all there, ready to export if you really want to. But you won’t, because you’ll finally trust the dashboard.

Resource utilization report in ActivityTimeline

Stop Paying the “True Cost”

Let’s be honest: Excel got you this far. It’s flexible, familiar, and free. But at scale, it becomes the duct tape holding your planning together—and duct tape doesn’t scale.

Every formula, every version conflict, every “Who changed this cell?” moment adds up. And those hidden costs? They compound quietly until you can’t tell where the time went.

ActivityTimeline is what happens when you stop duct-taping Jira and start running it like a system built for real visibility. It doesn’t just replace your spreadsheet; it eliminates the need for one.

Your future self and your team will thank you.

{{rich-cta-3}}

Want to see how much do you pay for Excel planning in your case and how much exactly you can save with ActivityTimeline?

Get a formula to estimate this by adding a few details about your team size, hourly rates, etc.

ActivityTimeline Illustration

Ready to stop paying for “free”?

Try ActivityTimeline for Jira free for 30 days.

ActivityTimeline Illustration
Join 2500+ people getting bi-monthly newsletter:
Event and webinar invitations
Project management tips
<0.3% unsubscribe
Free, forever
Thank you! 🙏🏻
Your submission has been received!
Oops! Something went wrong while submitting the form.

Frequently Asked Questions

No items found.
Still have questions about ActivityTimeline? Get in touch
Your most organized Jira workflow is just a click away
Start your 30-day free trial. No credit card required.
Planer | ActivityTimeline