
{{tl-dr}}
Effective project management requires visibility across three critical dimensions: what has already been done, what is currently being worked on, and what resources will be needed in the future. Timeline reports in Jira are the cornerstone of this visibility, transforming raw project data into actionable insights that help teams stay on track, meet deadlines, and optimize resource allocation. Timeline reports help project managers see the big picture and understand the overall project scope, while also enabling teams to maintain a bigger picture perspective for strategic planning and oversight.
ActivityTimeline provides three distinct categories of timeline reports, each designed to address specific project management needs. These timeline reports are created and developed to facilitate planning, tracking, and reporting progress.
Whether you’re conducting retrospective analyses of logged time, planning task sequences, or forecasting future resource requirements, understanding which timeline report to use—and when—can dramatically improve your team’s efficiency and project outcomes.
{{rich-cta-1}}
Introduction to Timeline Reports
A timeline report is a powerful visual representation that maps out project data, milestones, and events in chronological order, making it a crucial tool for effective project management. By laying out project stages and key dates along a timeline, project managers gain a clear overview of project progress and can easily track important deadlines and deliverables.
Timeline reports help teams manage complex projects by breaking down the entire timeline into manageable phases, highlighting dependencies, and pinpointing potential bottlenecks before they impact the project. With the ability to create and customize timeline reports using various tools and templates, teams can ensure that every event, milestone, and task is accounted for, enabling more informed decision-making and effective project tracking.
Whether you’re overseeing a single project or juggling multiple initiatives, timeline reports provide the visual clarity and structure needed to keep your team focused and your projects on track.
Benefits of Using Timeline Reports
Timeline reports offer a range of benefits that make them indispensable in modern project management. By providing a visual representation of the project plan, these reports allow project managers and stakeholders to quickly grasp the status of project progress, upcoming milestones, and critical deadlines.
Timeline reports make it easy to track performance metrics and identify areas where adjustments may be needed, supporting data-driven decision-making throughout the project lifecycle. The collaborative nature of timeline reports ensures that teams are aligned, with everyone working from the same page and towards shared goals.
Customizable templates and interactive features allow project managers to tailor reports to the unique needs of each project, making it simple to highlight key information for different audiences.
Ultimately, timeline reports help teams manage resources more effectively, meet deadlines, and deliver successful projects by keeping all stakeholders informed and engaged.
Getting Started with Timeline Software
Getting started with timeline software is straightforward, thanks to a wide range of user-friendly tools and templates designed for project managers at every experience level. By following a few simple steps, you can create a timeline report that tracks project progress, highlights key milestones, and keeps your team aligned.
Regular updates and collaborative features ensure that your timeline reports remain current and relevant, helping teams work together more effectively and deliver successful projects. With the right timeline software, you can focus on what matters most—planning, tracking, and achieving your project goals.
Timeline Timesheets: Historical Activity Tracking
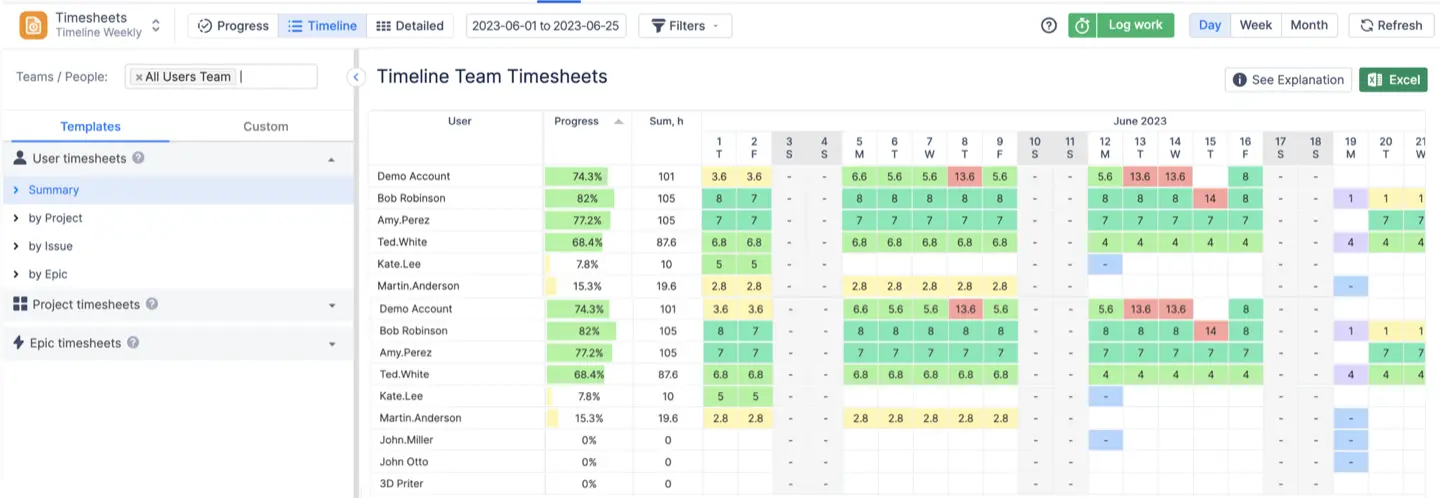
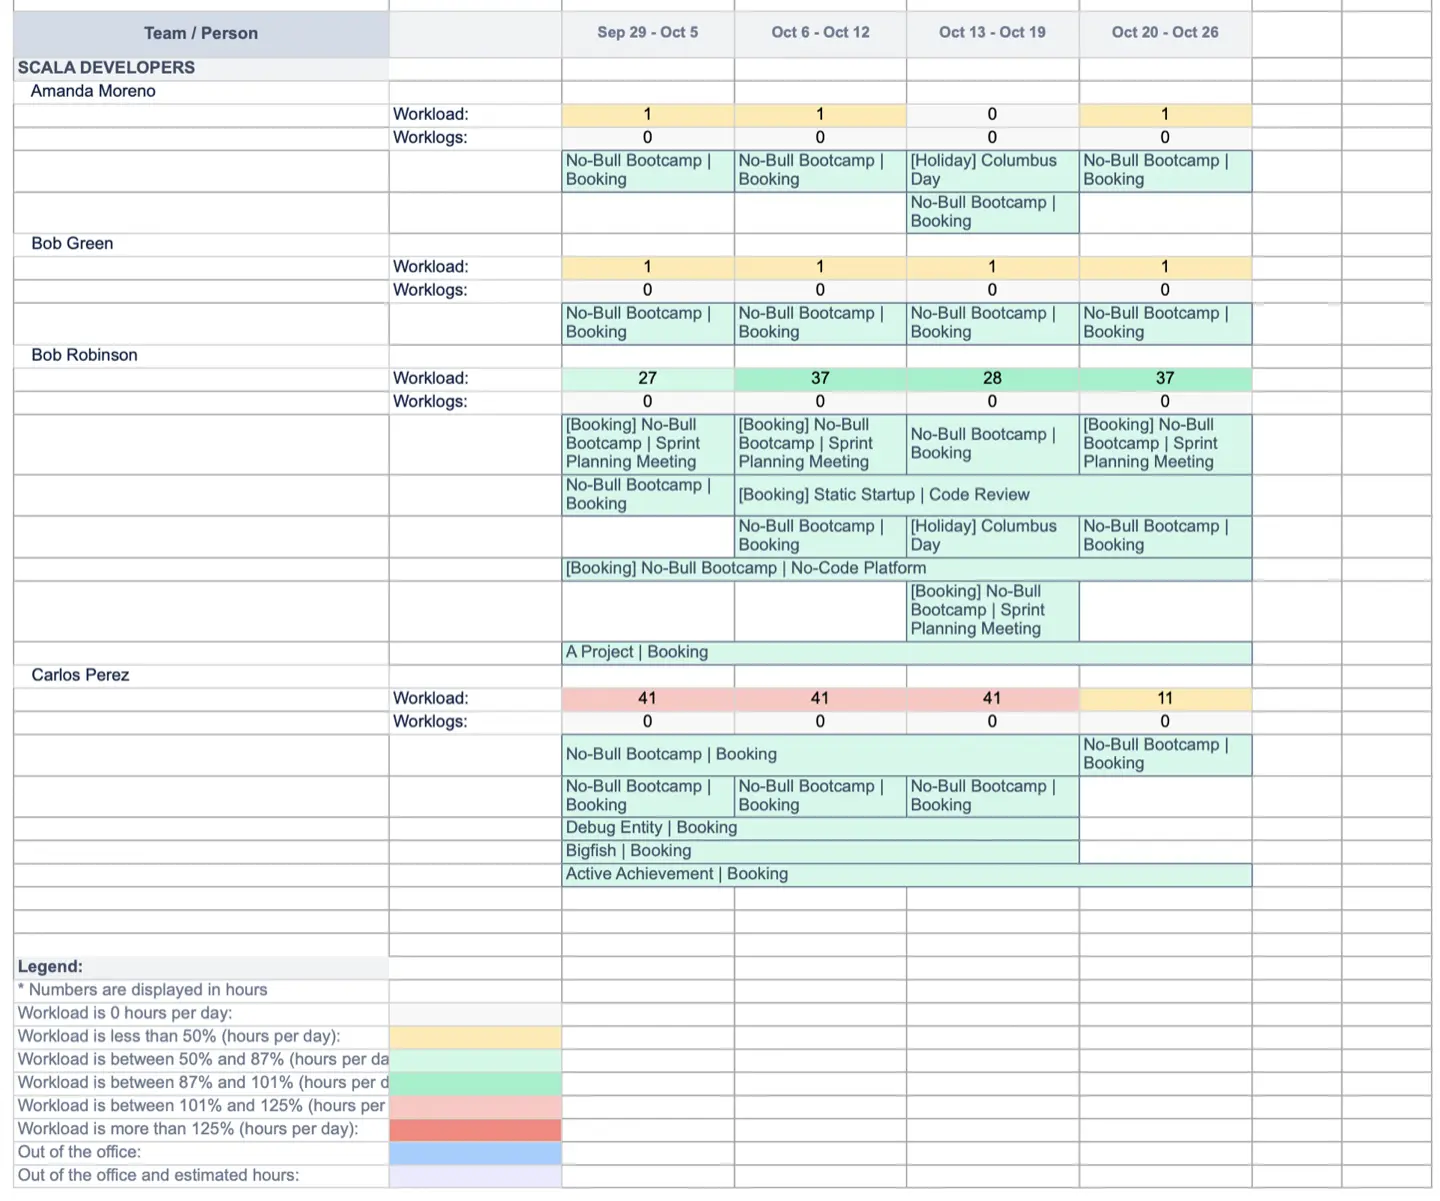
Timeline Timesheets provide a visual, color-coded overview of historical time entries logged by your team members. Detailed reports are generated to provide insights into team activity and performance over specific periods. This report type is your primary tool for understanding past utilization, auditing time-logging compliance, and conducting retrospective analyses.
Key Features
- Visual Progress Tracking: The report displays a simplified view of users and their time-logging progress over any selected historical period. Color-coded visualizations quickly indicate whether a user is over-logging or under-logging time relative to their assigned tasks or configured work capacity.
- Historical Data Focus: Unlike planning tools that focus on future work, Timeline Timesheets draw exclusively from completed worklogs, providing access to valuable historical information about where time was actually spent across all project phases.
- Granular Detail: The interactive nature of the report allows you to drill down by clicking directly on a user’s name or a specific date cell to view detailed worklogs for that particular day. The report also displays non-working days like holidays and vacations alongside logged work, offering a complete picture of team activity.
- Flexible Time Ranges: Adjust the date range to review any historical period—from a single week to the last 12 months—making it ideal for long-term trend analysis and performance reviews. You can also review end dates for tasks to analyze project completion and ensure timelines are met.
Teams use Timeline Timesheets in various ways; for example, software development teams track sprint completion, marketing teams review campaign durations, and consulting firms analyze billable hours. These examples show how Timeline Timesheets help track historical activity across different industries.
Primary Use Cases
- Auditing and Compliance: Project managers can quickly verify if team members have logged the required number of hours for specific weeks or months. For example, a project manager might use the report to check if all hours were properly logged for the second week of March. The color-coded format makes compliance issues immediately visible at a glance.
- Retrospective Analysis: Review how time was allocated across projects over extended periods to identify patterns, bottlenecks, and opportunities for process improvement.
- Performance Metrics: Generate detailed performance reports for individual users or specific projects by analyzing logged hours against planned estimates.
- Billing and Client Reporting: Filter timesheets by worklog categories or specific clients to create accurate billing reports and demonstrate time investment to stakeholders.
Project Timeline for Resources: Visualizing Task Sequences
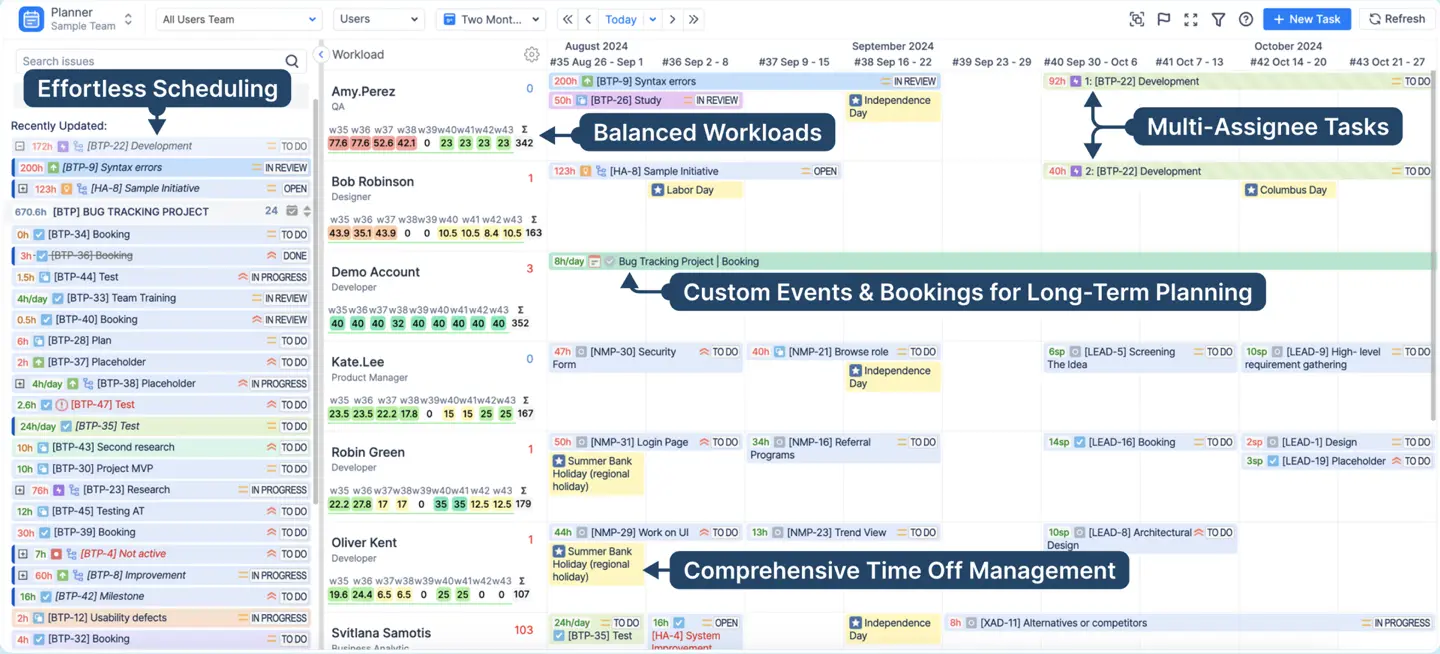
Project Timelines in ActivityTimeline’s Plan mode provide a dynamic view of task sequences, dependencies, and project phases. Project plans are visualized and managed using timeline reports, helping teams outline and coordinate each stage. This view functions similarly to traditional Gantt charts, allowing teams to see the entire project landscape, track end dates, and make real-time scheduling decisions. Project timelines are created and developed to meet the specific needs of each project, ensuring effective planning and progress tracking.
Key Features
- Real-Time Planning: The Plan mode enables project managers to visualize the current state of all tasks, schedule and unschedule work from the backlog, and easily edit timelines for flexibility as project conditions change.
- Task Distribution: Easily split tasks between multiple team members or reassign work to balance workloads and meet shifting priorities.
- Dependency Management: View how tasks relate to one another and understand the impact of delays or changes to individual work items on the overall project timeline. Mapping dependencies helps teams visualize project flow and manage schedules more effectively.
- Milestone Tracking: Identify critical milestones and key dates to ensure that major deliverables stay on schedule.
Primary Use Cases
- Sprint Planning: Visualize the scope of upcoming sprints and ensure that tasks are properly sequenced, highlighting the importance of task sequence for sprint success, and assigned before work begins.
- Backlog Management: Pull work from the backlog into active timelines based on team capacity and project priorities.
- Deadline Monitoring: Track progress toward key dates and milestones, adjusting plans proactively when delays are identified.
- Cross-Team Coordination: See how work across multiple teams or departments aligns, preventing conflicts and ensuring smooth handoffs.
Teams use Project Timeline in various ways; for example, software development teams map out the sequence of feature releases, while marketing teams plan campaign rollouts, and construction teams coordinate project phases. These examples show how Project Timeline supports planning and coordination across different industries.
Resource Timeline Reports: Forecasting Future Capacity
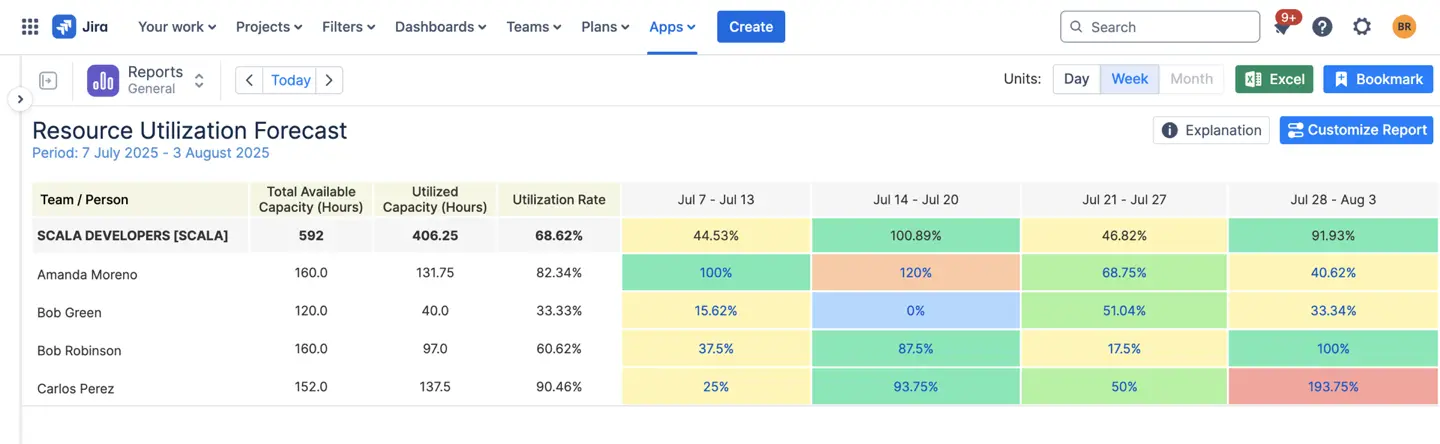
Resource Timeline Reports shift focus from the past and present to the future, providing aggregated and detailed forecasts of resource utilization. These reports help project managers answer critical questions about capacity, availability, and allocation across upcoming project phases. By offering a clear view of future resource needs, resource timeline reports support project strategy and long-term planning. Tracking resource allocation through these reports also contributes to project success by ensuring goals are met and projects remain on schedule.
Two Forecast Levels
Aggregated Resource Forecast: Provides a high-level overview of team capacity and utilization across all projects. This view helps identify whether your team is over-allocated or under-utilized in the coming weeks or months, enabling proactive resource balancing. By offering this perspective, project managers can maintain a bigger picture view of resource allocation, ensuring alignment with overall project goals and long-term planning.
Detailed Resource Forecast: Offers granular visibility into resource utilization broken down by specific projects, epics, tasks, or other work items. This detailed view allows managers to see exactly where each team member’s time is forecasted to be spent and identify potential bottlenecks or gaps before they impact project delivery.
Key Features
- Capacity Planning: Compare forecasted work against available team capacity to ensure realistic project timelines and prevent burnout.
- Multi-Project Visibility: See how resources are allocated across multiple concurrent projects, making it easier to balance competing priorities and adjust plans when conflicts arise.
- Scenario Planning: Model different allocation scenarios to understand the impact of adding or removing team members, shifting deadlines, or reprioritizing work. These scenarios are presented visually, allowing for easy comparison and clearer decision-making.
- Workload Balancing: Identify team members who are over-allocated and redistribute work to maintain sustainable workloads and project momentum.
Primary Use Cases
- Resource Allocation: Determine whether you have sufficient capacity to take on new projects or whether additional resources are needed by using forecasts generated from your data to inform decision-making.
- Risk Management: Identify potential resource constraints early, allowing time to mitigate risks through hiring, outsourcing, or timeline adjustments.
- Strategic Planning: Use forecast data to inform long-term hiring plans, budget requests, and project portfolio decisions.
- Client Communication: Provide clients and stakeholders with realistic timelines based on actual resource availability rather than optimistic estimates.
Exporting Timeline Data: Excel and API Integration
All timeline report types in ActivityTimeline support robust export capabilities, ensuring that data can flow seamlessly into your broader project management ecosystem.
Excel Export
Both Timesheets and Planning views can be exported to Excel (CSV format) for further analysis, customization, and presentation. This functionality is particularly valuable for:
- Creating custom charts, graphics, and visuals for stakeholder presentations
- Performing advanced data analysis using Excel’s built-in tools
- Archiving historical records for compliance or auditing purposes
- Sharing data with team members who don’t have direct ActivityTimeline access
API Integration
ActivityTimeline’s API provides programmatic access to timeline data from both actual logged time (Timesheets) and forecasted work (Planning). This enables:
- Automated data synchronization with other project management or financial systems
- Custom dashboard creation using your organization’s preferred business intelligence tools, including mapping data fields between ActivityTimeline and these tools for seamless integration
- Integration with client reporting systems for automated invoicing and progress updates
- Data pipeline creation for advanced analytics and predictive modeling
Choosing the Right Timeline Report
The key to effective project management is knowing which timeline report to use for each situation:
Use Timeline Timesheets when you need to:
- Audit historical time-logging compliance
- Conduct retrospective performance reviews
- Generate billing reports for clients
- Analyze long-term utilization trends
Example: Use Timeline Timesheets to review an example of a consultant’s logged hours for a completed project to ensure accurate client billing.
Use Project Timelines when you need to:
- Plan upcoming sprints or project phases
- Adjust task sequences and dependencies in real-time
- Balance workloads across team members
- Track progress toward immediate milestones
Example: Use a Project Timeline to visualize the phases of a product launch, showing an example of how tasks and deadlines align for marketing and development teams.
Use Resource Timeline Reports when you need to:
- Forecast future capacity and identify constraints
- Plan resource allocation across multiple projects
- Model different staffing scenarios
- Make strategic decisions about new project intake
Example: Use a Resource Timeline Report to see an example of how designers are allocated across multiple projects, helping to identify potential overbooking.
These examples show how different teams use timeline reports to address a variety of project management needs.
{{rich-cta-3}}
Conclusion
Timeline reports are not one-size-fits-all tools. ActivityTimeline's three-tiered approach—covering historical activity tracking, current project planning, and future resource forecasting—ensures that project managers have the right insights at the right time. By leveraging Timeline Timesheets for retrospective analysis, Project Timelines for real-time planning, and Resource Timeline Reports for capacity forecasting, you can build a comprehensive view of your team's work that spans past, present, and future.
The ability to export all of this data via Excel or API further extends the value of these reports, allowing seamless integration with existing workflows and tools. Whether you're managing a single agile team or coordinating resources across a complex project portfolio, ActivityTimeline's timeline reports provide the visibility and flexibility needed to deliver projects on time, on budget, and with optimal resource utilization.


![Top 11 Best Jira Add-ons: A Detailed Guide [2026]](https://cdn.prod.website-files.com/60c76f07dc83db305171350c/692dadbde37b1016cdc2657e_thumbnail_Best%20Jira%20Plugins.png)