


Jira knows what the work is. It does not know whether the people assigned to it have the hours, what they actually spent, or what it cost. ActivityTimeline adds those three answers on top of your Jira, in five modules that share one set of data. Pick a tab to see what each one does.
Planner
Jira resource and capacity planning
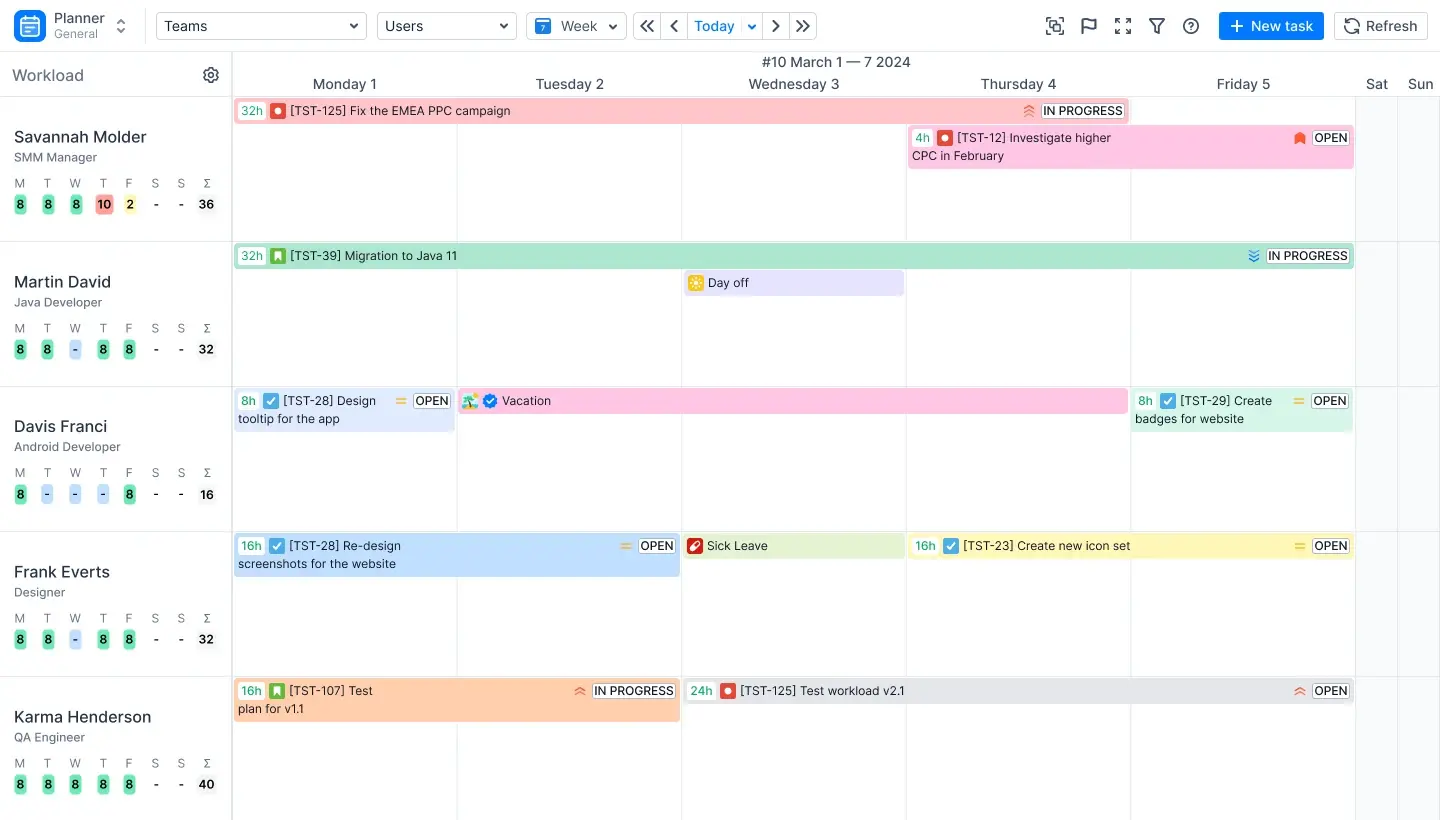
See who is overloaded before the sprint starts
Under every person on the timeline sits a workload indicator: hours planned against hours available, per day, per week or per month depending on how far you zoom out. Eight colors do the talking. Yellow and olive mean there is room, green means full, light red and red mean overloaded, blue means out of office, grey means nothing planned. Switch the indicator to Availability mode and it shows the remaining hours instead, which is the number you want when someone asks "can Anna take one more?". The thresholds are yours: if 6 planned hours is a full day for your team, set it and the colors follow.
Plan people and teams on the same screen
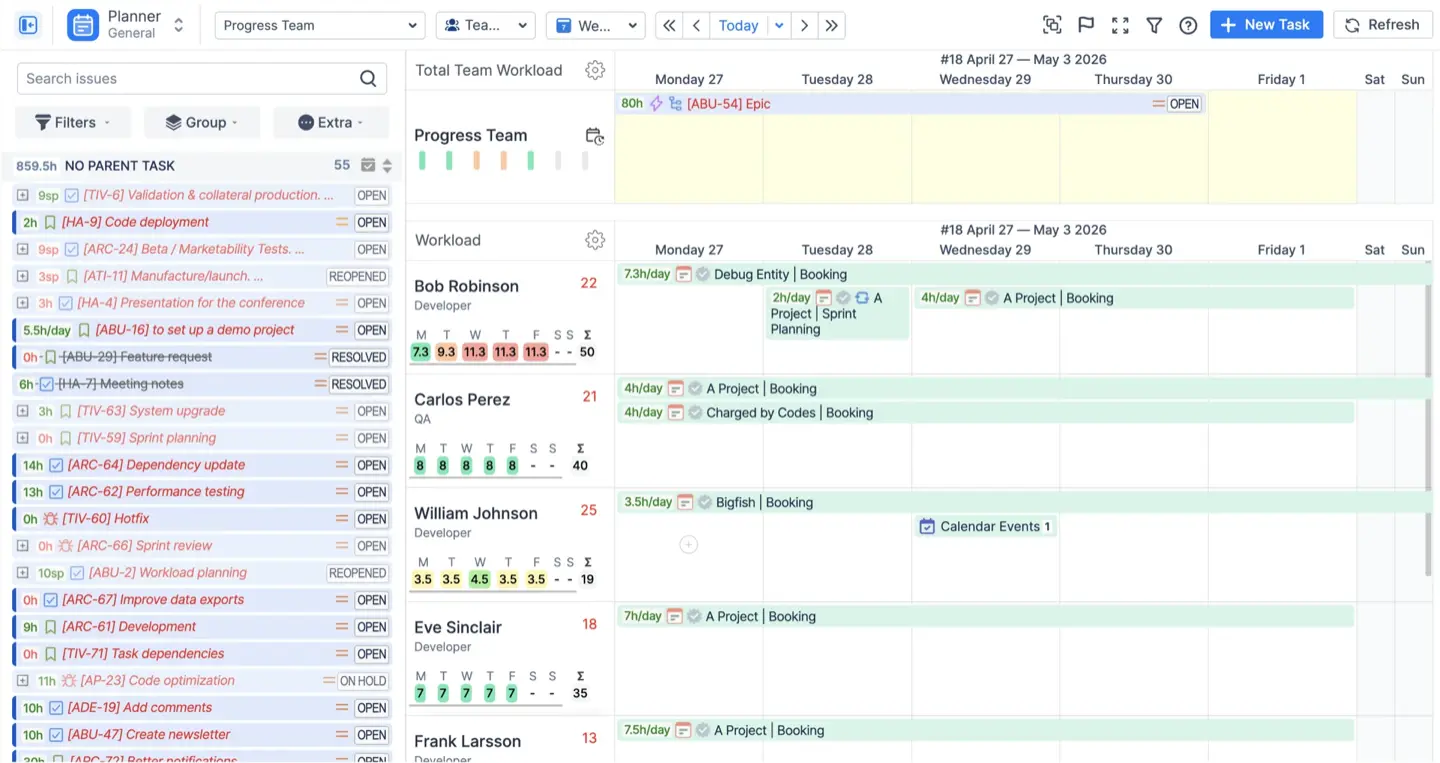
Short term you plan people; long term you plan teams. The Team with Users view shows the team row on top with work that is not yet assigned to anyone, and the members underneath with their tickets. Sprints, releases and deadlines sit on the milestone panel above the rows. You can look at one team, several, or a project team panel that shows only the people on that project. Save any of these views as a dashboard, with the period included, so "Q4 platform team" opens in Q4 without fiddling.
Try a plan without touching Jira
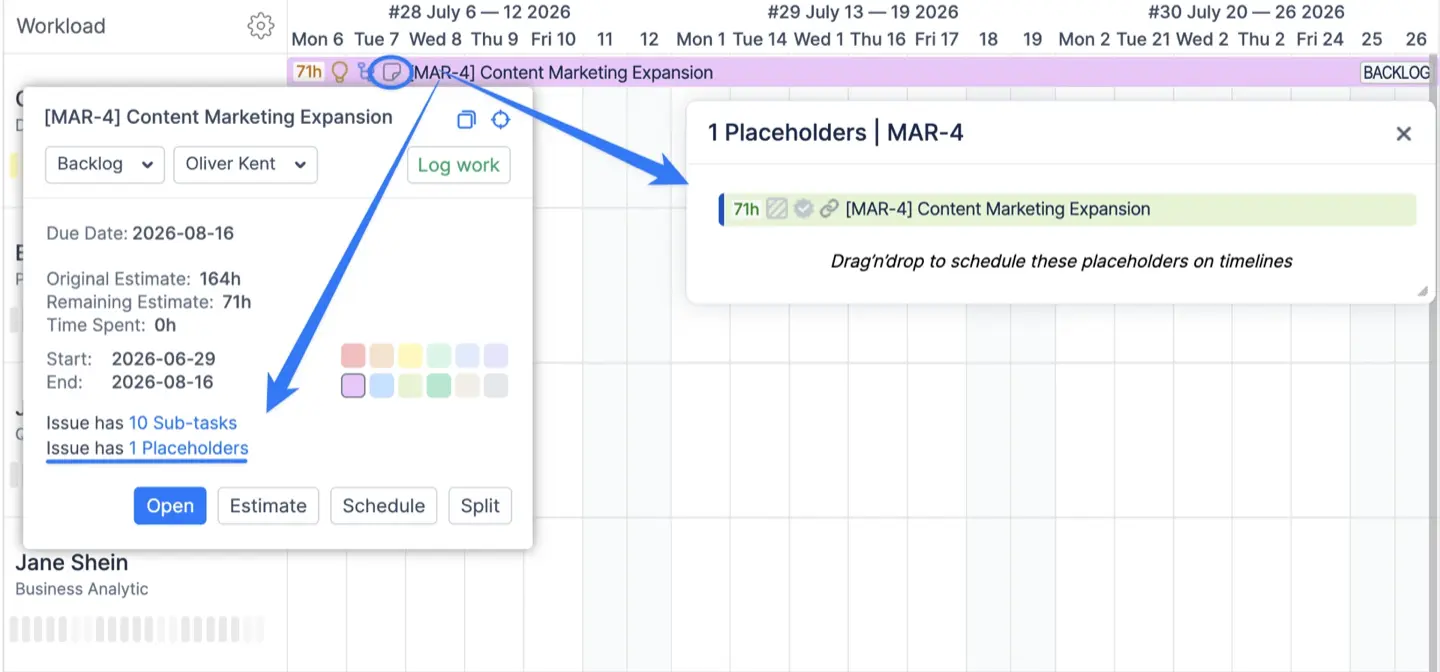
Placeholders are "what if" items. Block out a project on a team or a person, move it around, see what the indicators say, and nothing changes in Jira. When the plan is agreed, approve the placeholder and it becomes a real issue, description included. For a first draft of a sprint, auto scheduling takes a filtered set of issues and spreads them across the available people by capacity, which you then fix by hand. When a plan changes, bulk reschedule moves a whole set of issues at once and issue dependencies show what else moves.
Everything else that is not a Jira issue
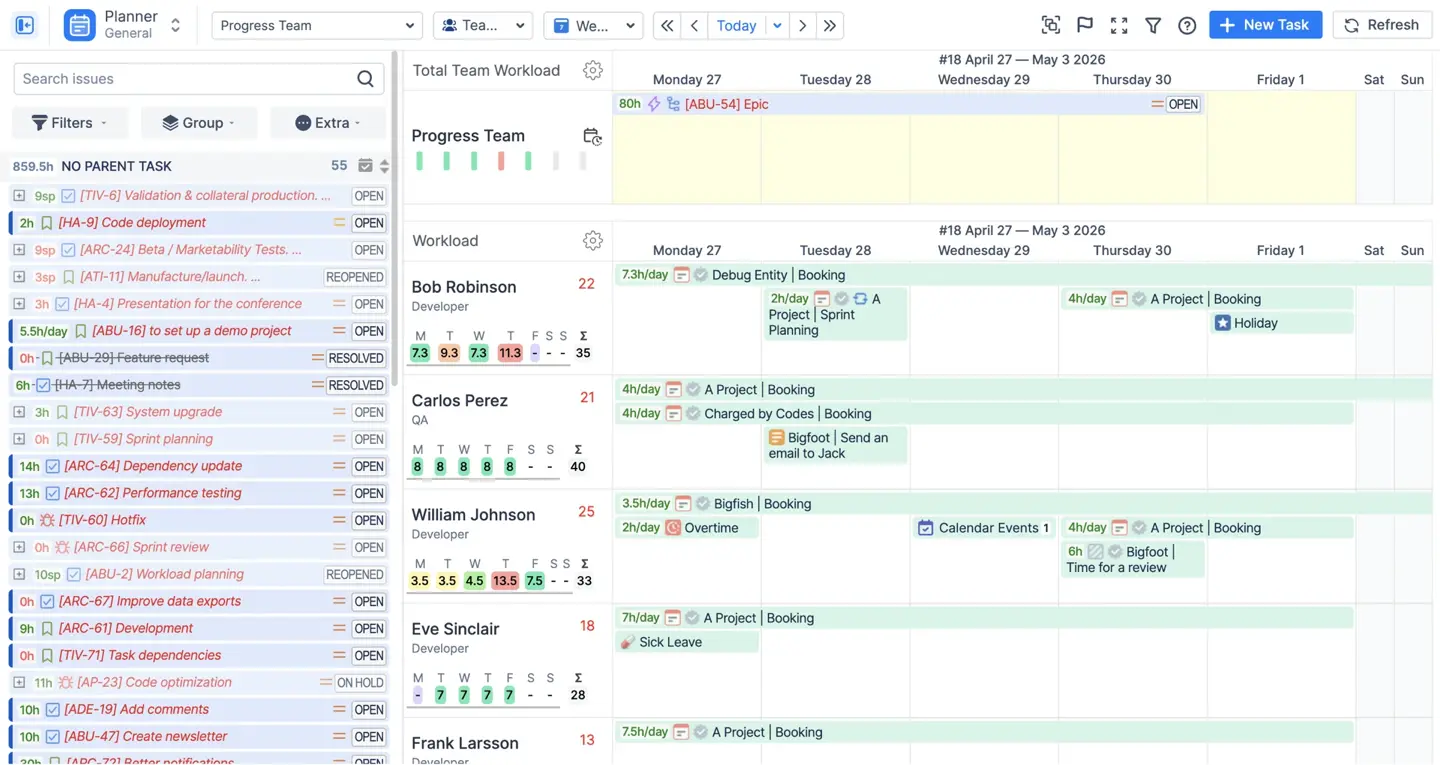
Vacations, sick leave, public holidays from a holiday scheme, a half day off, a booking of three hours a day for a client, a note saying "on call". Eight built-in event types plus your own, each one doing the right thing to capacity, and approval switchable per type. Google Calendar, Outlook and iCal events can be imported so a Tuesday full of meetings looks full.
Split one issue across several people or dates
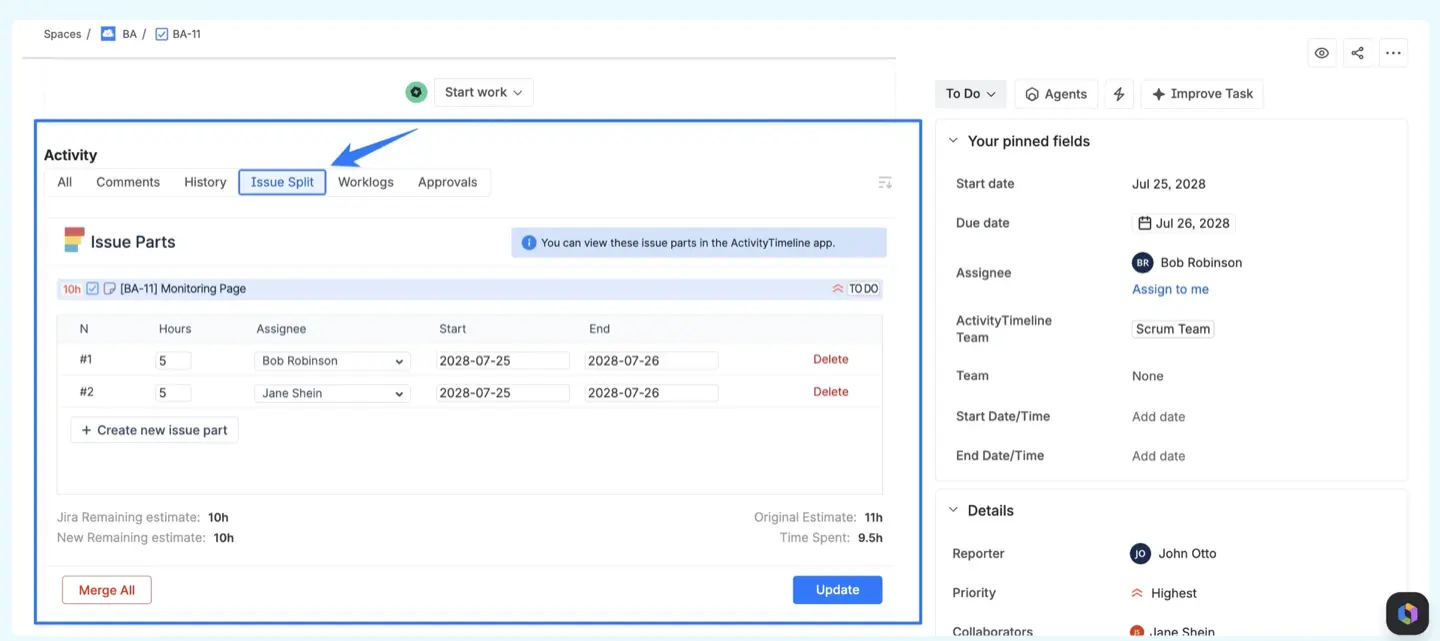
Hold Shift while dragging an issue and it splits, so two people can share one ticket or one person can work it in parts on different dates. The parts stay one Jira issue. If an issue has placeholders attached, the bar shows how many, so tentative work is visible next to committed work.
Workspace
Personal task and time tracking
One page per person
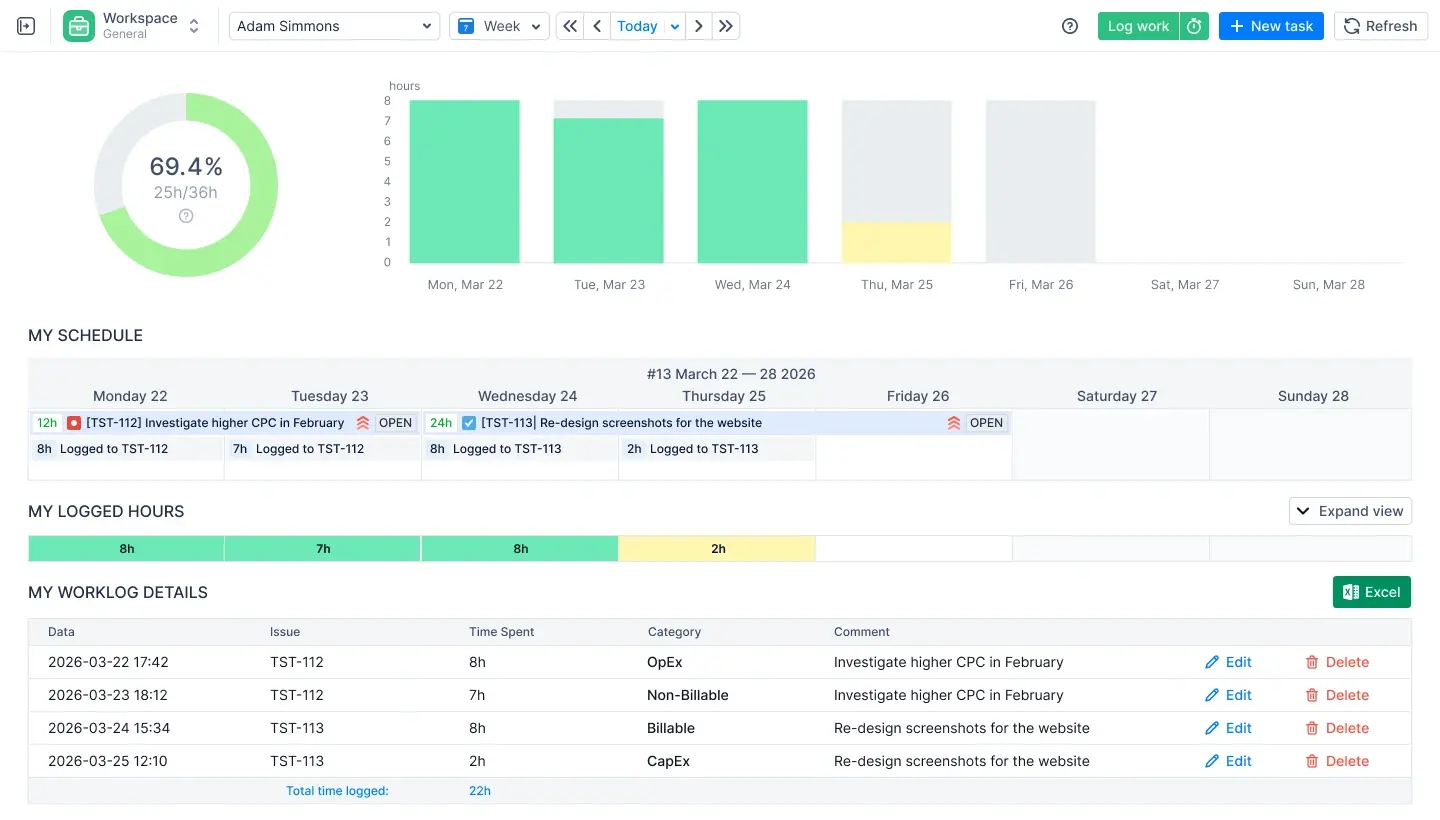
Your issues from every project in one panel, your schedule for the week in the middle, and your logged hours against required hours on top. Change a status, schedule an issue, log time, all without opening Jira. Managers and team leads can switch to any team member's Workspace to see the same page for them.
Time tracking people actually do
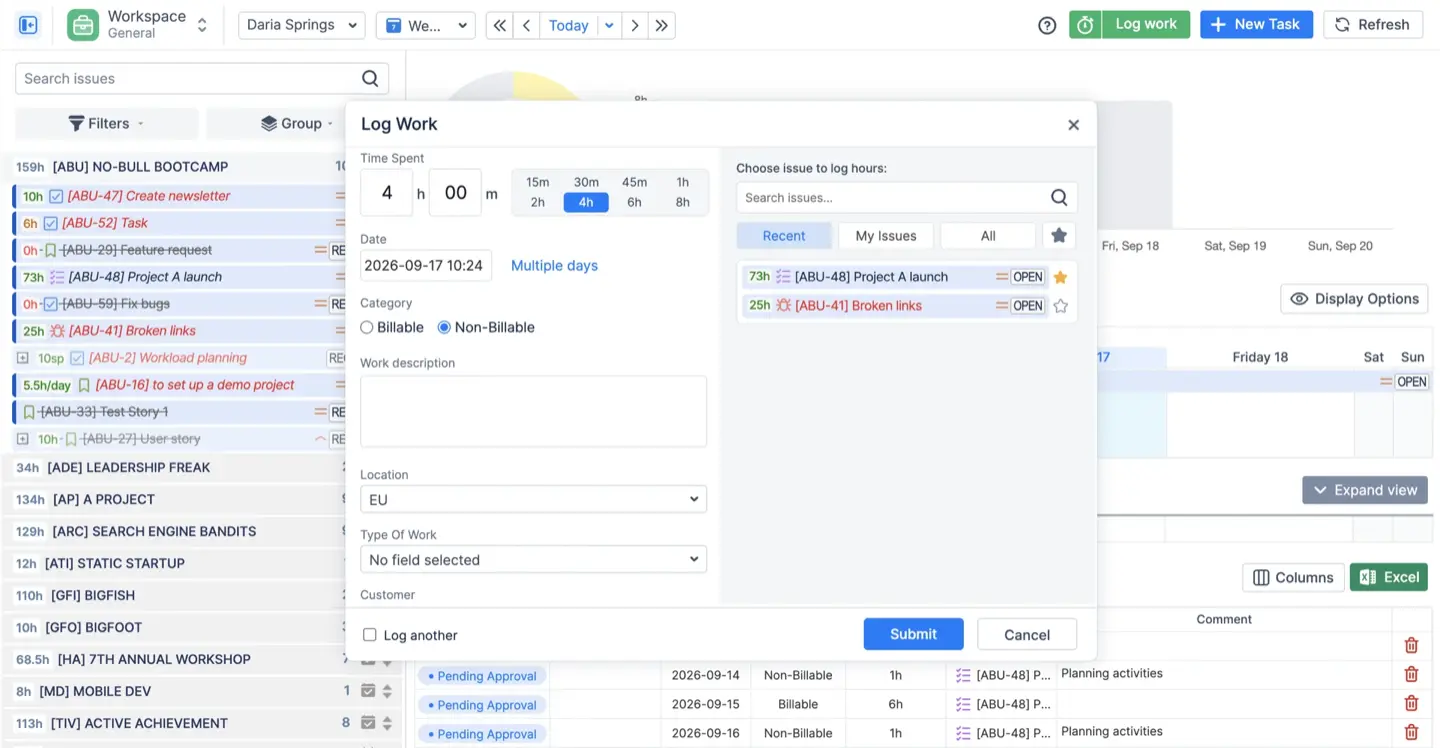
Timesheets fail because logging is annoying, so people do it on Friday from memory. Here the lazy option is the honest one: log from the issue card in one click, start a timer and forget it, keep your daily issues as favorites, pick from the Recent tab, or log straight from a Google Calendar event. Worklog categories let people mark time as billable or non-billable, or as whatever kinds of work your organization distinguishes. Custom worklog attributes carry anything else finance asks for. All of it flows into timesheet grouping and, on the Advanced Edition, into cost and revenue rates.
Timesheets
Timesheet reports for Jira
Three views of the same hours
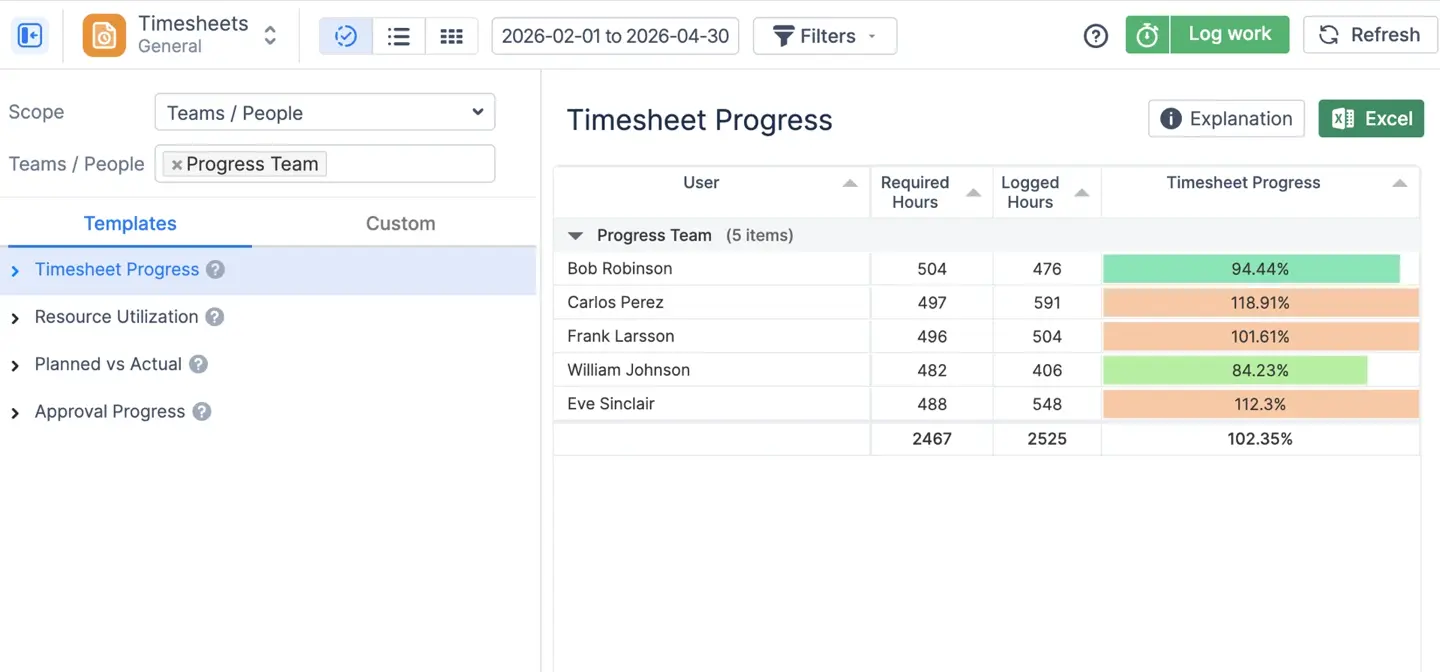
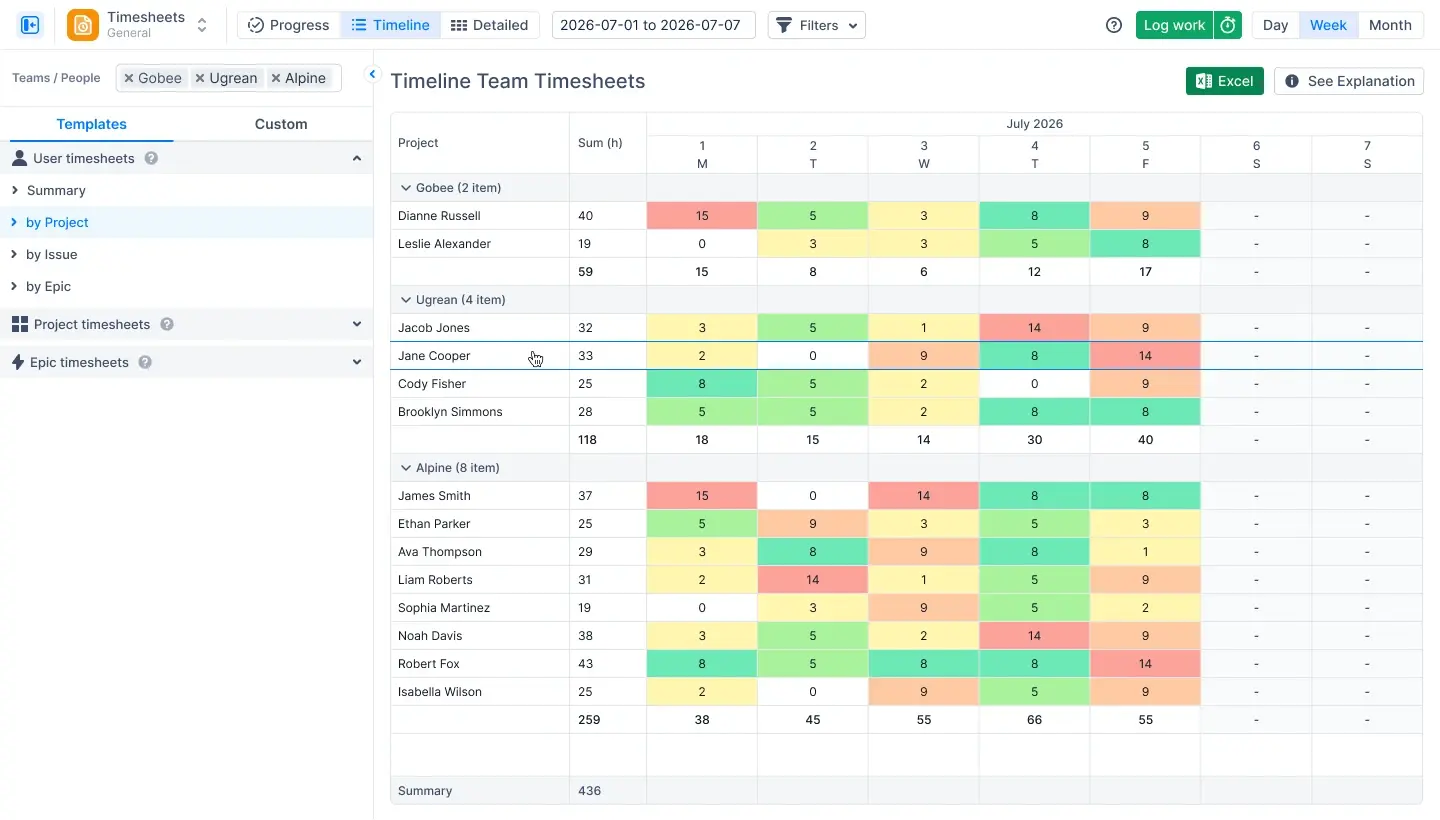
Progress shows required against logged hours per person, which is the "who has not filled in their sheet" view. Timeline shows hours per user per day with colors for over- and under-logging. Detailed is every worklog entry as a row. Same data, three questions.
Group it the way the question is asked
By user, project, epic, sprint, release, position, component, any Jira custom field, or any worklog attribute, several levels deep, and you can reorder the levels by dragging. Filter by worklog type to separate Jira worklogs from bookings and imported calendar events. Switch the whole thing to days instead of hours if that is how you plan.
Approvals that lock
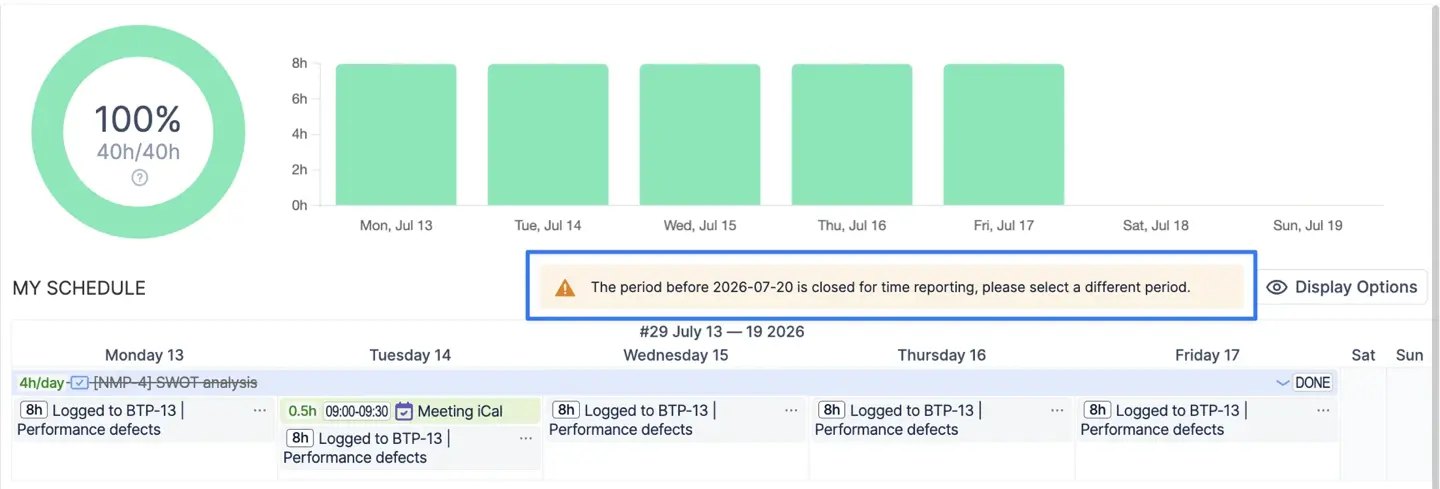
Turn on the approval workflow and worklogs get submitted, approved and locked, with a record of who approved what. Bulk approve for large teams. Team leads approving their own sheets is a setting, off by default. Admins can limit how far back anyone may log, from a few days up to 75, which matters if you close books monthly.
The export finance asked for
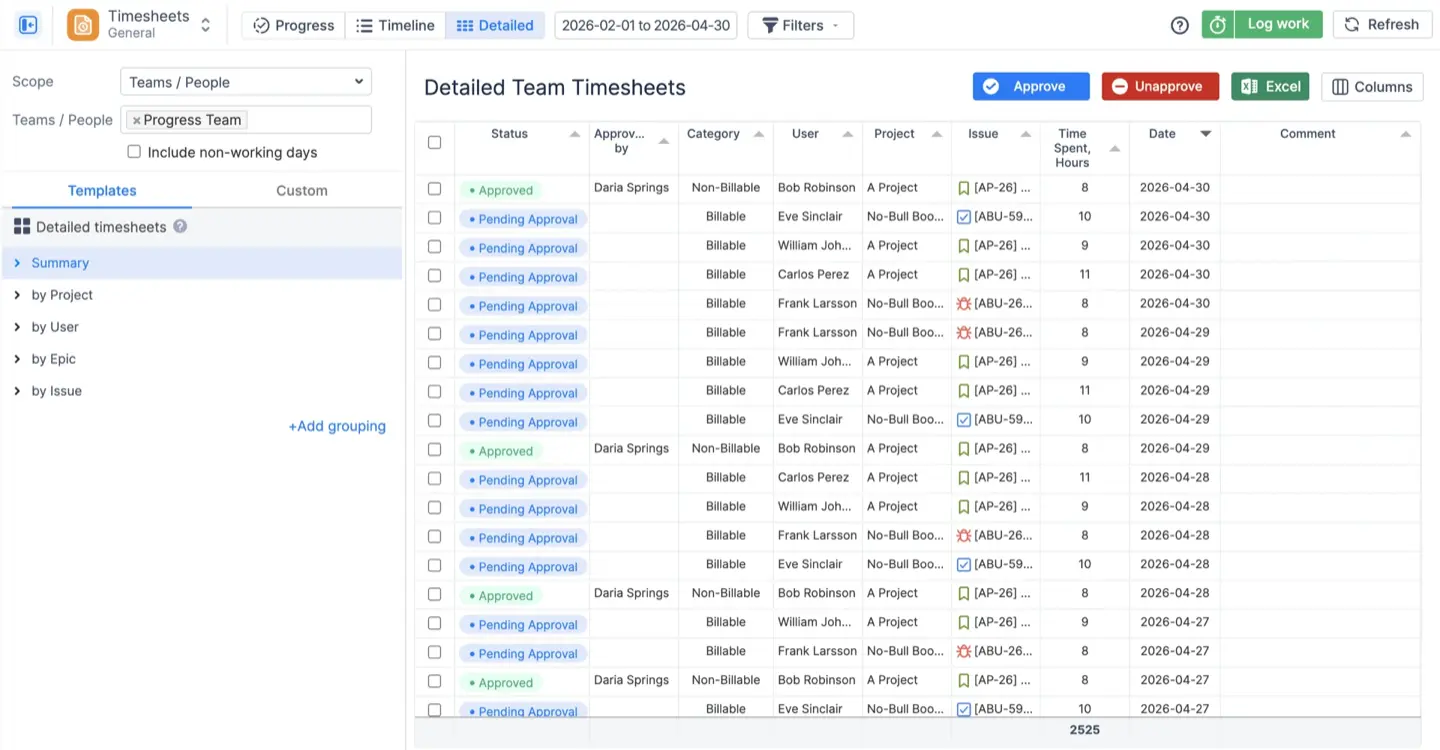
Add any Jira field as a column in the Detailed timesheet: customer, priority, cost center, whatever the invoice needs. Export to Excel with one click. Reports can also be bookmarked, shared, and placed on a Jira dashboard as a gadget.
Reports
Jira workload and project reports
Resource Utilization Forecast
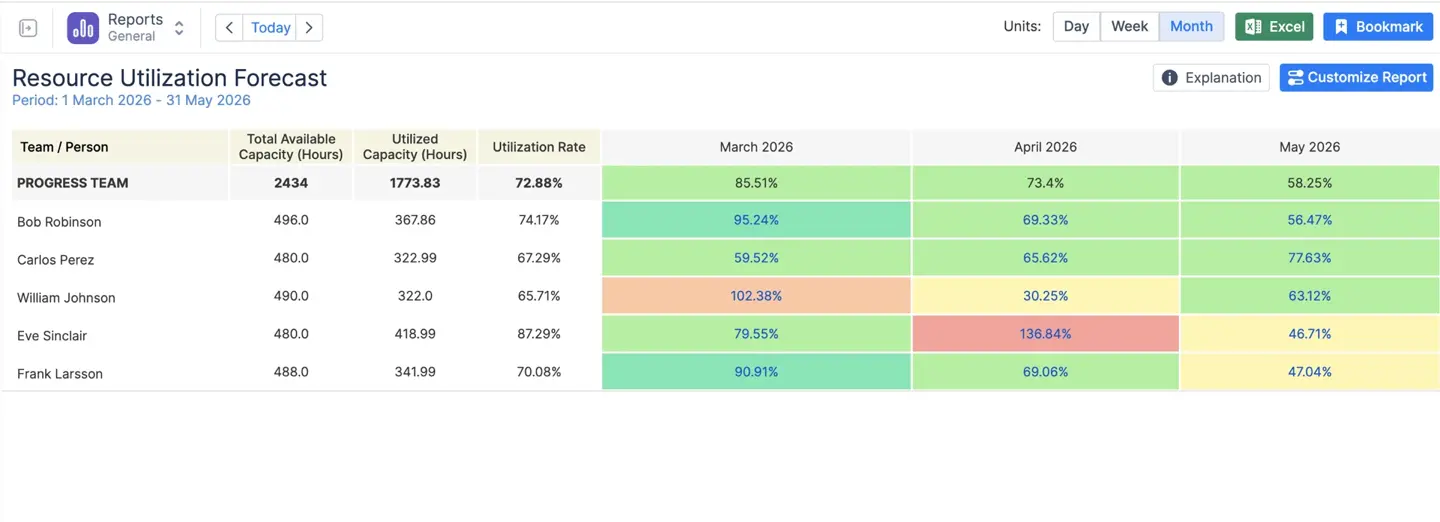
Remaining estimates against capacity for the months ahead, by team or by person, so you find out in March that you need two more QA engineers in June and not in June. Available capacity, used capacity, and the gap, per period.
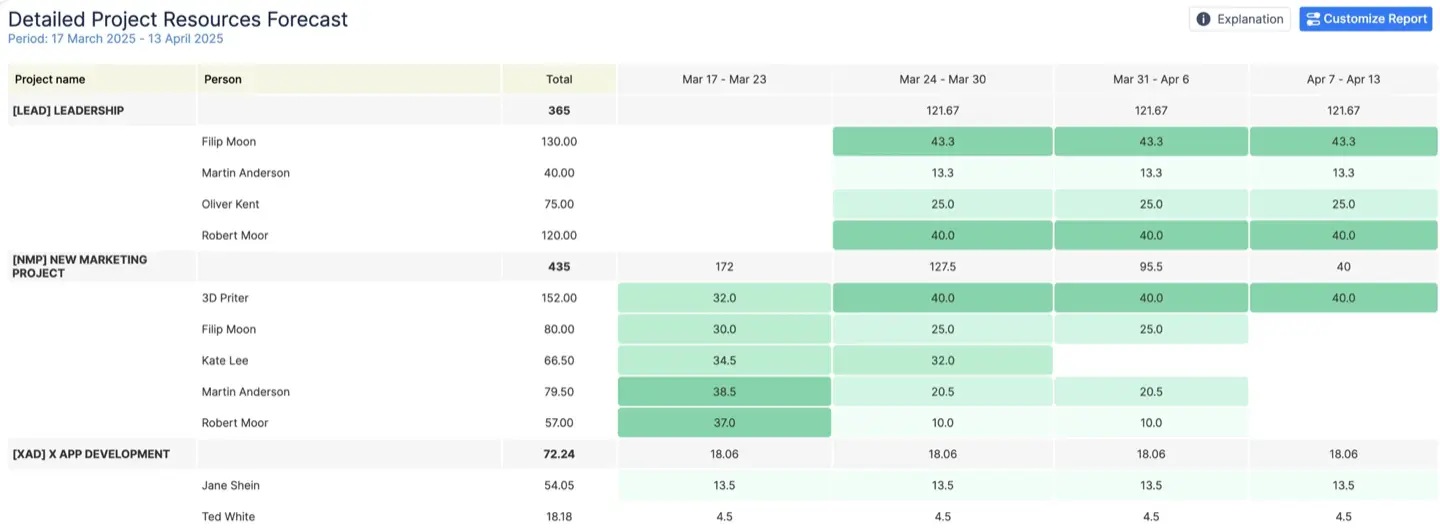
Project Resources Forecast
How people are scheduled per project, across several projects and teams at once. Team-level assignments are counted alongside individual ones, so a quarter plan that is still on the team row shows up in the totals. Export to Excel if the steering committee wants a spreadsheet.
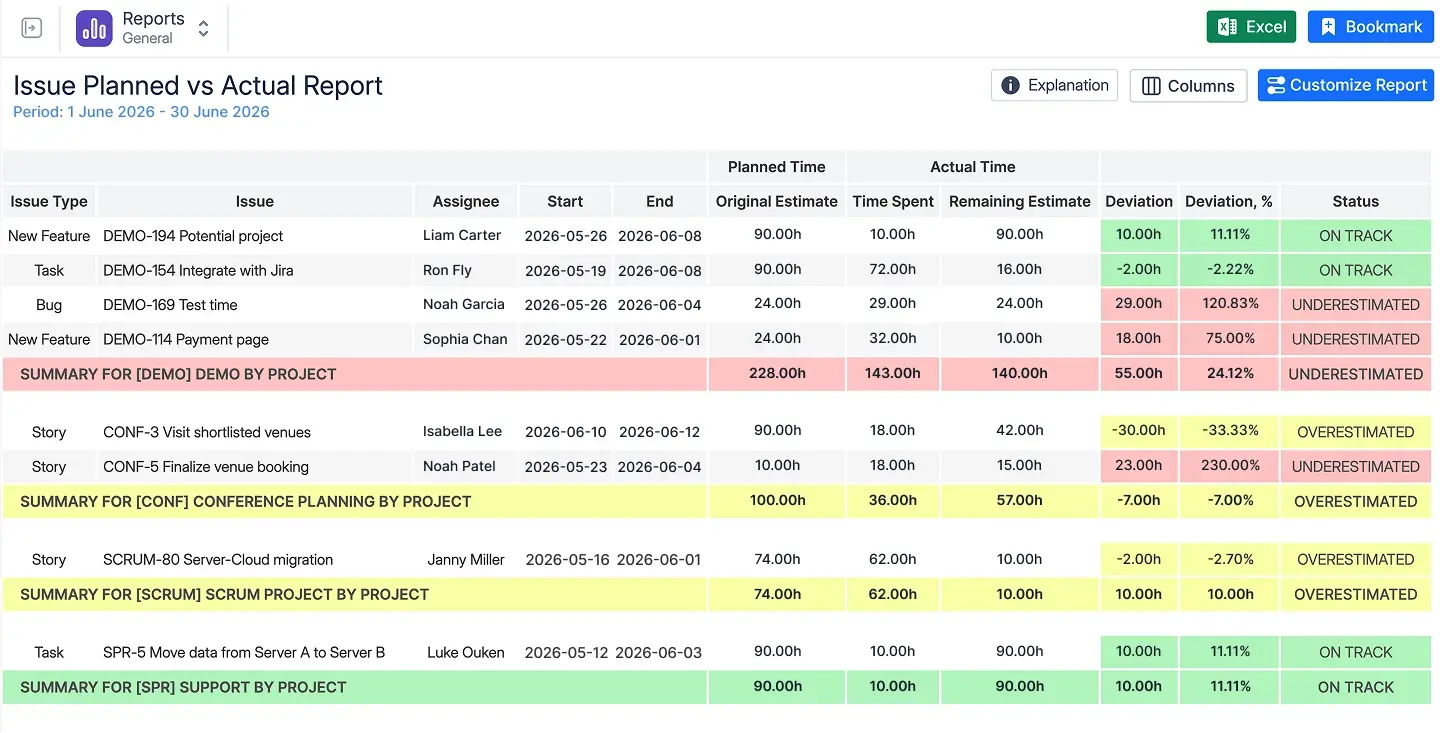
Planned vs Actual
Original estimate against logged time per project and team over a period, with a deviation threshold you set, so you see which projects are running over and by how much before it becomes a delay. Project Progress does the same by completed hours or completed story points.
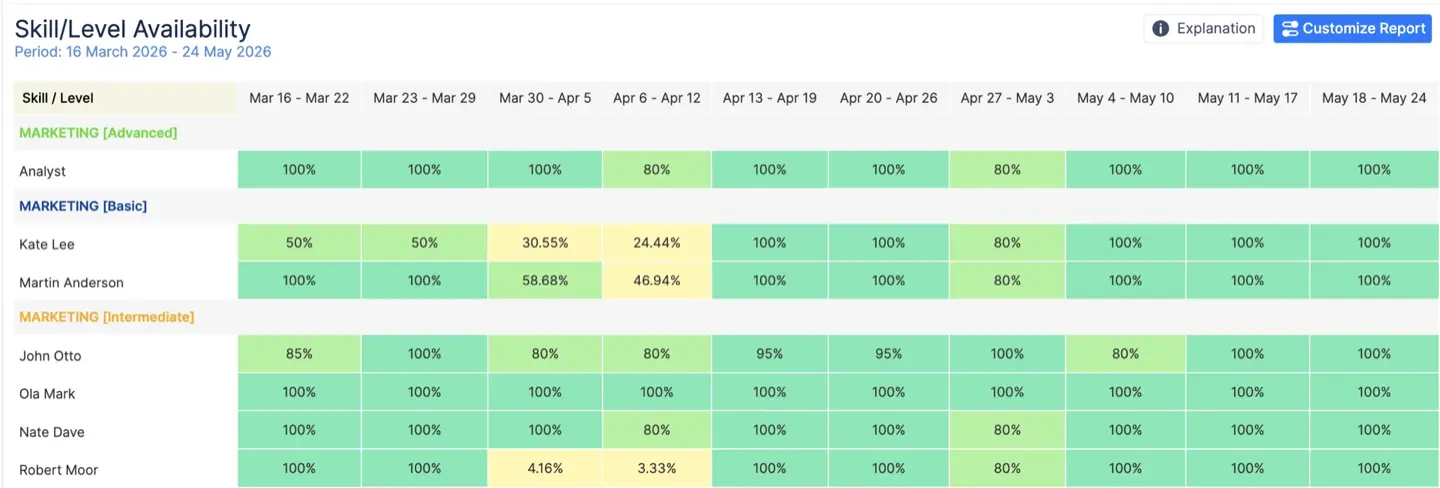
Availability by skill and position
"Is Anna free in May" is easy. "Is any senior Java developer free in May" is the real question, and the Skill and Position Availability reports answer it. There are Team and Person Availability reports for the simpler version, and leave reports for who is out when.
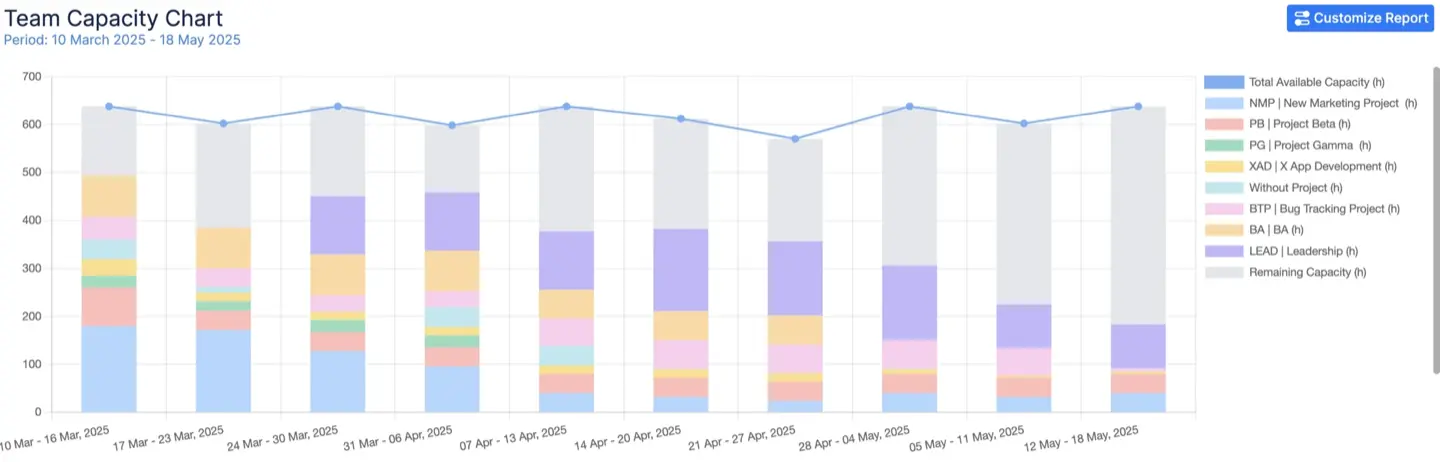
Charts
Team Capacity Chart over months, grouped by issue, epic or custom field, team level or drilled down to people. Team Utilization Pie Chart for the "where did the quarter go" question. Planned vs Actual Chart for the same comparison as the report, as a picture.
Finances
Cost and revenue tracking. Advanced Edition, Cloud.
The question Jira cannot answer
"How much is this project actually costing us?" Jira tracks effort, not money, so the usual answer is a spreadsheet someone rebuilds every month from a timesheet export. Finances takes the hours already logged in ActivityTimeline, applies the rates you set, and keeps the answer current. Nobody logs time twice and nobody exports anything to find out where the budget stands.
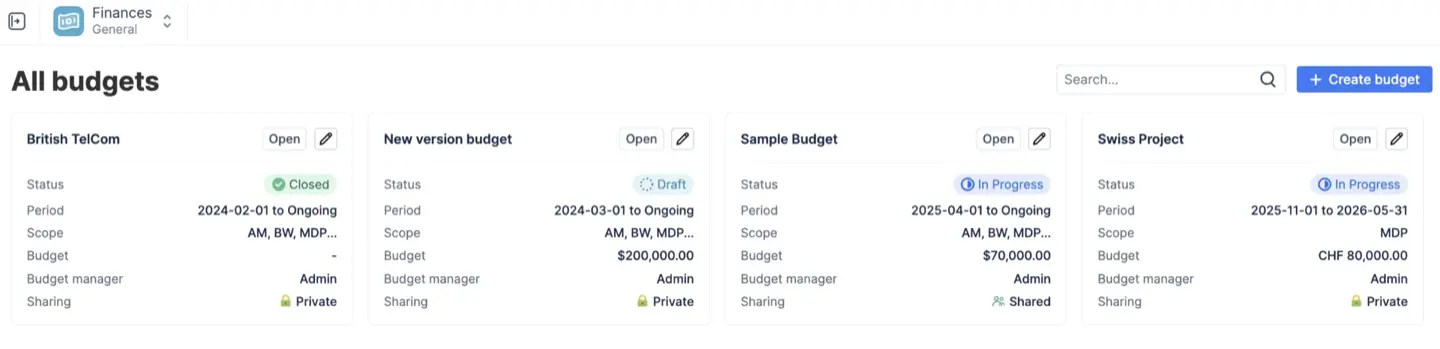
A budget is a scope plus a cap
Create a budget and point it at a Jira project, a set of epics, or a saved JQL filter. Give it a period, or no end date for things like maintenance and internal IT that never end. Then set the cap: a manual amount that leadership approved, optionally broken into milestones, or an estimate-based budget that the app calculates from the original estimates in scope times your cost rates. Cost tracking and revenue tracking are switched on independently, so an internal department can track cost only and an agency can track both.
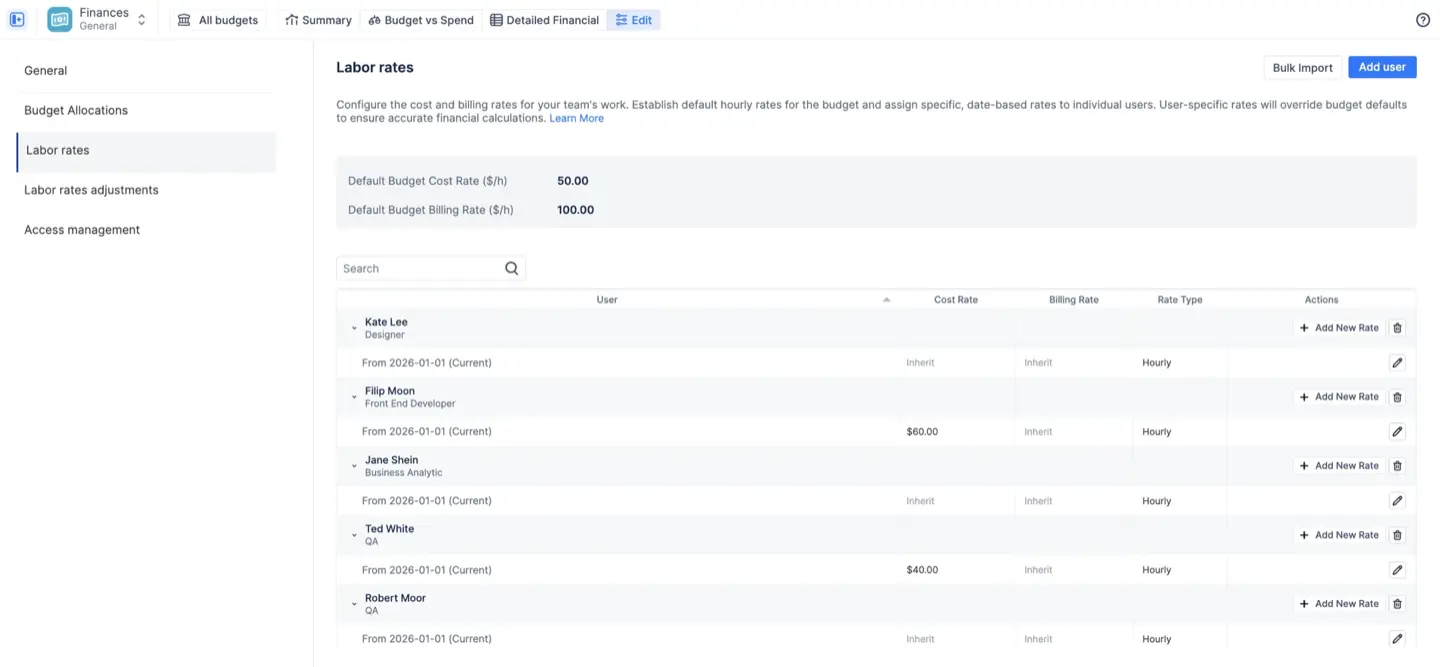
Rates that match how you actually pay people
Each person gets a cost rate (what they cost you) and a billing rate (what you charge for them), hourly or monthly. Monthly rates suit salaried staff and retainers and are prorated across the days of the month. A category rate on top handles the cases where the same hour costs or bills differently, for example urgent support at 1.5 times the base rate, or non-billable at zero. Rates are effective-dated, so a raise in March applies from March and February's numbers stay as they were. Import a whole team's rates from a Jira group or an ActivityTimeline team instead of typing them one by one.
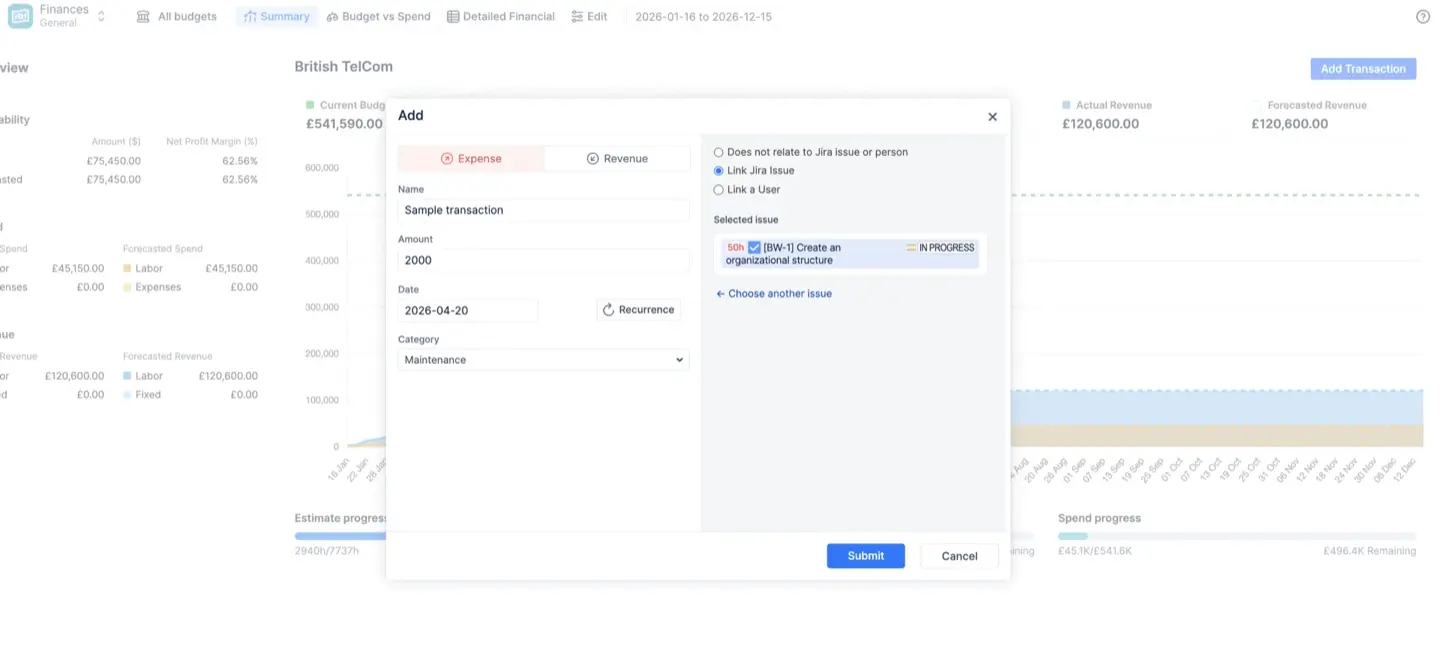
Costs that are not hours
Licenses, contractor invoices, travel, hosting. Add them as manual transactions, as an expense or as revenue (a milestone payment, a retainer), link them to an issue or a person if you want, and set a recurrence so a monthly hosting fee enters itself. They land in the same reports as labor costs.
Three reports, from the boardroom to the ledger
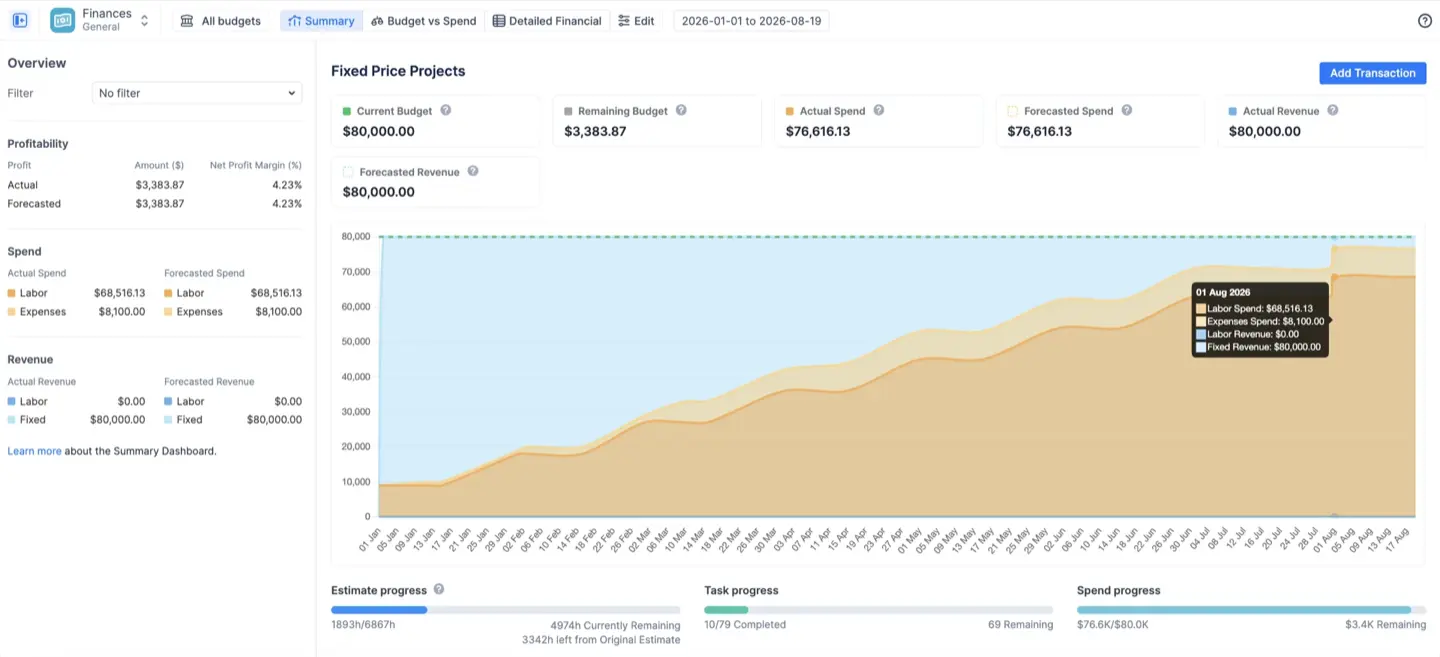
The Summary dashboard is the one-screen answer: current budget, remaining budget, actual and forecasted spend, actual and forecasted revenue, profit and margin, plus a trend chart where you see the burn heading over before the month closes.
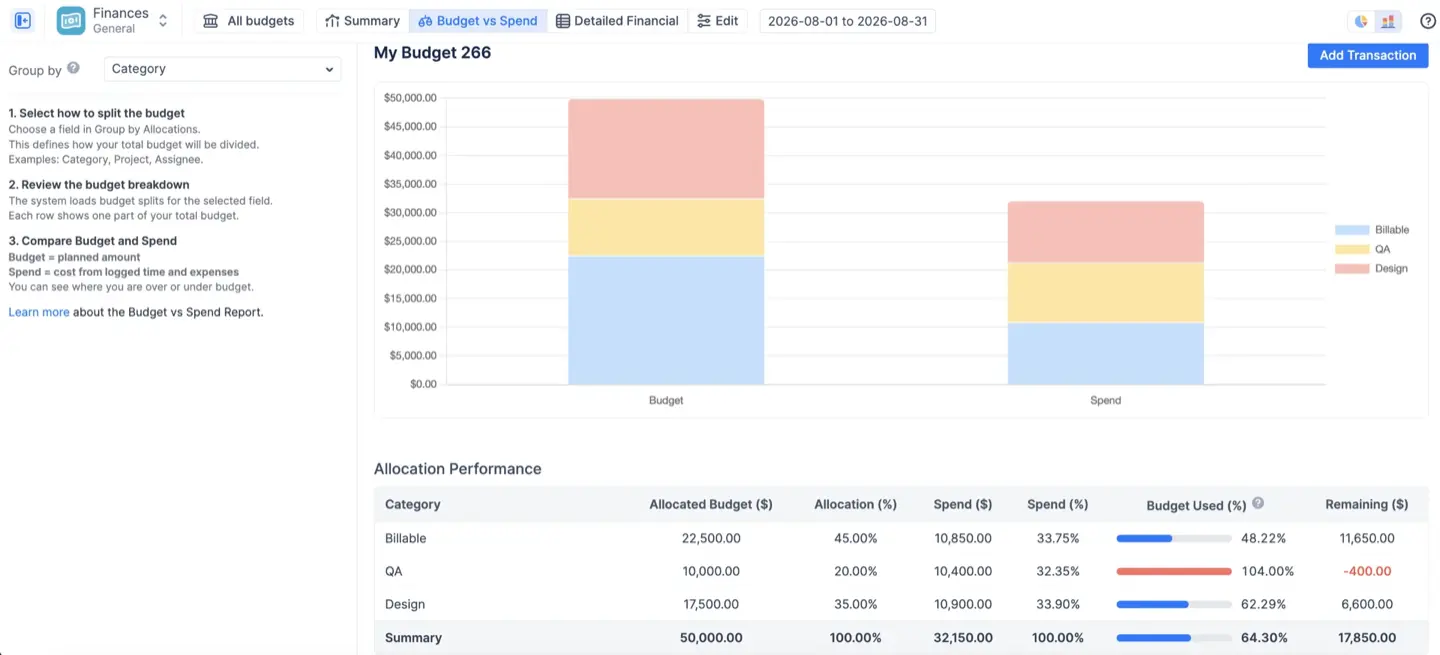
Budget vs Spend compares what you allocated to each category, project, epic, person or component against what was actually spent, as pie charts for proportions or bars for amounts, with a table underneath showing allocated, spent, budget used and remaining per line, colored on track, fully spent, over budget or unallocated. A $50,000 budget with 20 percent allocated to non-billable work that is actually consuming 32 percent shows up as one red bar.
The Detailed Financial Report is the ledger: every logged hour and every transaction as a line with the rate applied and the resulting cost and revenue. Filter by date range, export to Excel, hand it to finance or an auditor.
Budget vs Spend compares what you allocated to each category, project, epic, person or component against what was actually spent, as pie charts for proportions or bars for amounts, with a table underneath showing allocated, spent, budget used and remaining per line, colored on track, fully spent, over budget or unallocated. A $50,000 budget with 20 percent allocated to non-billable work that is actually consuming 32 percent shows up as one red bar.
The Detailed Financial Report is the ledger: every logged hour and every transaction as a line with the rate applied and the resulting cost and revenue. Filter by date range, export to Excel, hand it to finance or an auditor.
What you get with Advanced
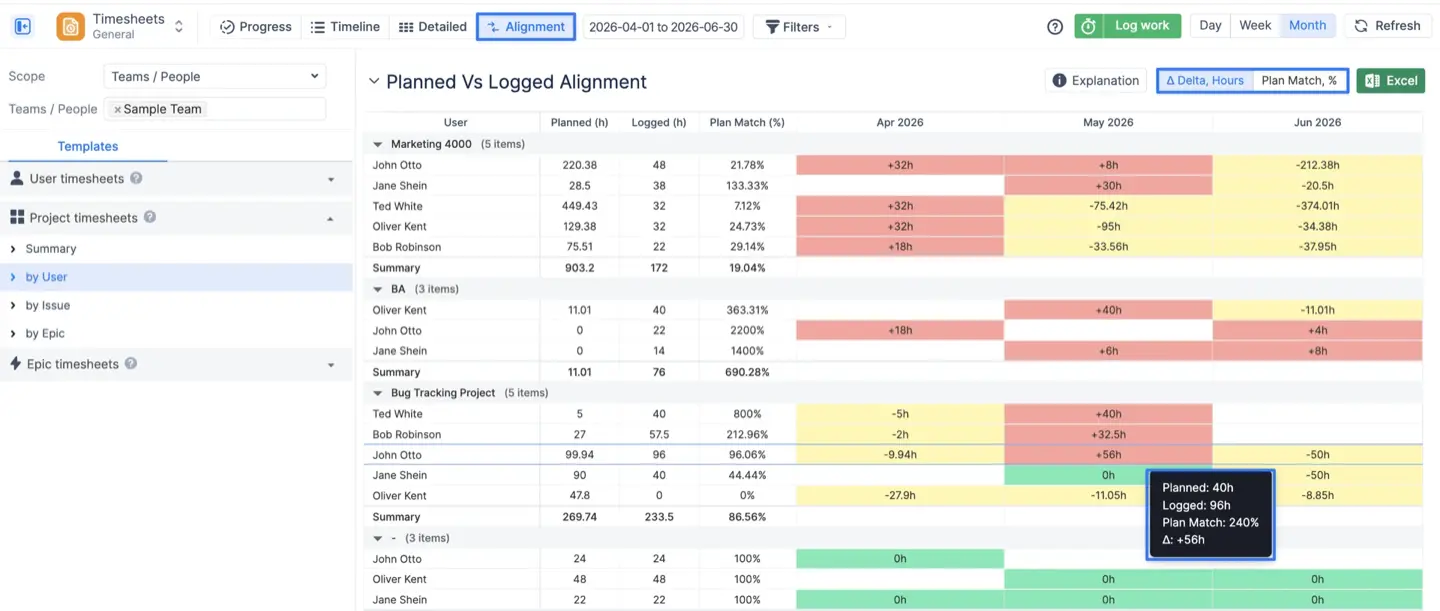
The Advanced Edition of ActivityTimeline Cloud includes everything in Standard plus Finances, the Alignment timesheet (planned hours against logged hours per person, as a delta or a match percentage, colored the same way as the workload indicator), a security log, and premium support. You can trial either edition and switch between them during or after the trial. Finances is Cloud only for now; if you are on Data Center and need it, tell us, because that is how we decide what to build next.
Compare editions ↗
Finances documentation ↗
The quickest way to see whether this fits is to run it against your own Jira for a couple of weeks. The trial is 30 days, no credit card, and you can start on Advanced to see Finances and drop to Standard afterwards if money tracking is not your problem.
Schedule demo
Get started
Finances documentation ↗
The quickest way to see whether this fits is to run it against your own Jira for a couple of weeks. The trial is 30 days, no credit card, and you can start on Advanced to see Finances and drop to Standard afterwards if money tracking is not your problem.
Schedule demo
Get started


