
{{tl-dr}}
The end-of-week timesheet review is a process most project managers dread. You’re faced with a wall of raw data—endless rows of work logs, inconsistent time entries, and the nagging feeling that you’re missing the real story. Native Jira time tracking is great at collecting data, but when it comes to presenting it in a useful way, it often falls flat. You get a list of logged hours, but zero context about workload distribution or team performance.
This isn't just an administrative headache; it’s a major blind spot in your project management. Without a clear understanding of where time is actually going, making realistic estimates, managing resource capacity, and ensuring accurate client billing becomes a challenging task. It's time to ditch the spreadsheets and embrace a smarter, more visual approach to time reporting.
Why Your Current Timesheet Process is Wasting Time
The problem with a traditional Jira time tracking report is that it forces you to connect the dots manually. You have the numbers, but you lack the narrative. This leads to several critical issues:
- No At-a-Glance Insights: You can't quickly see who is overloaded and at risk of burnout versus who is underutilized and has spare capacity. Identifying these patterns requires manually cross-referencing schedules and task lists—a time-consuming and error-prone process.
- Delayed Decision-Making: By the time you’ve manually compiled and analyzed the data, the opportunity to rebalance workloads or address a bottleneck has often passed. Missing deadlines can often be traced back to a workload imbalance that wasn't caught early enough.
- Inaccurate Billing and Forecasting: When you can’t easily distinguish billable hours from non billable work or see how actual time stacks up against the original estimate, both customer invoices and future project planning suffer.
Your timesheet shouldn't be a puzzle you have to solve. It should be a tool that gives you immediate clarity.
{{rich-cta-3}}
What if Your Timesheet Looked More Like a Heatmap?
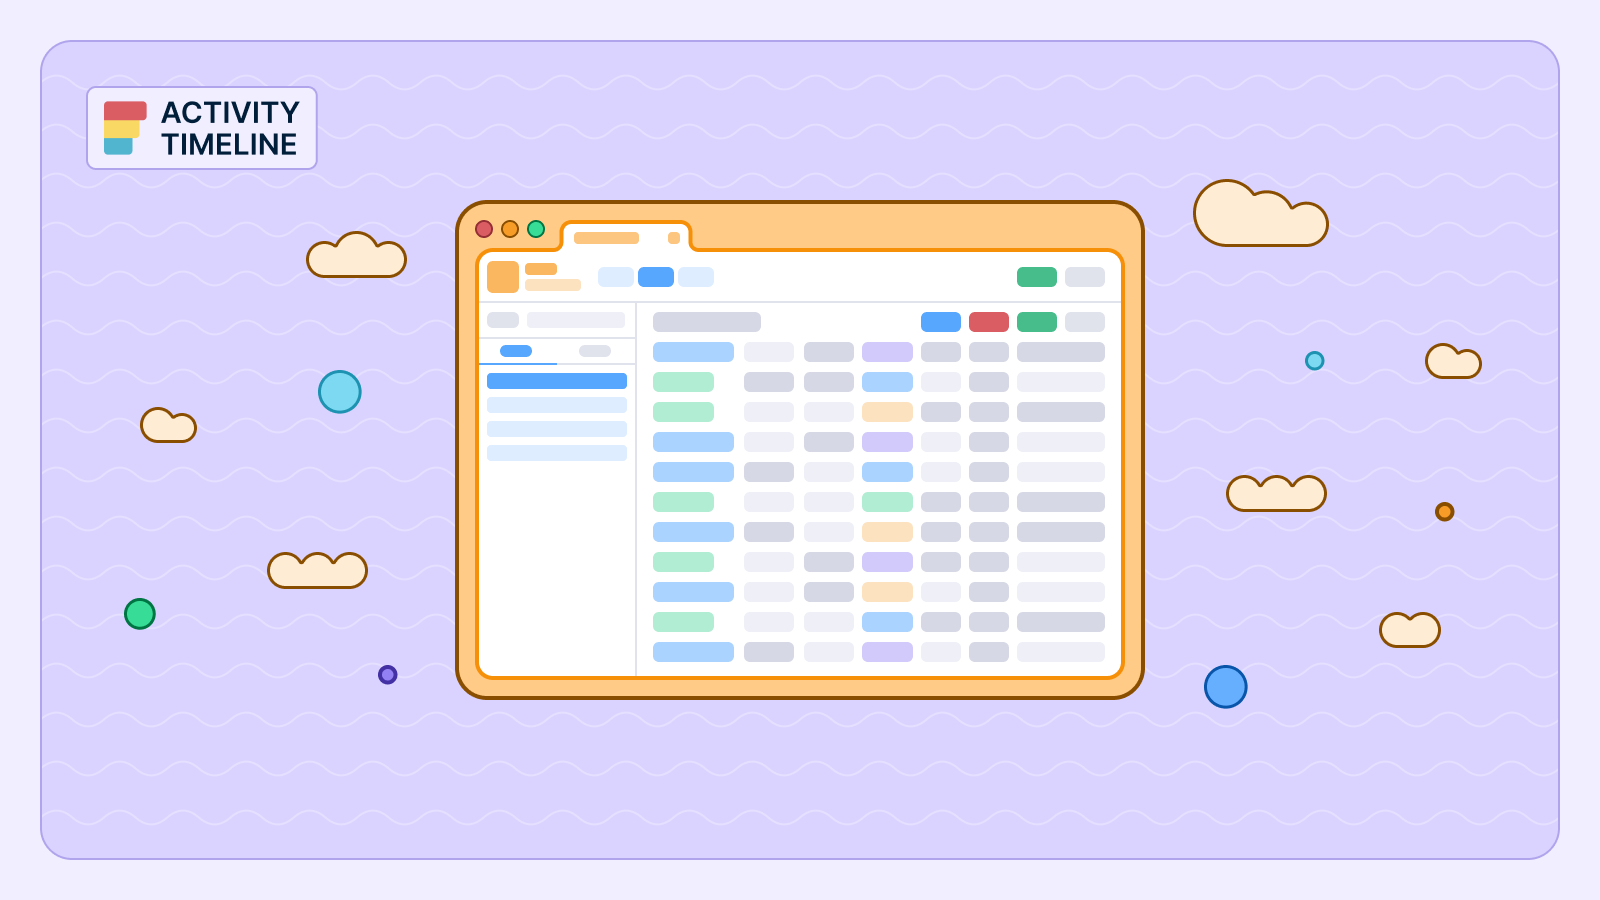
This is where ActivityTimeline’s Timeline Team Timesheet changes the game. It throws out the traditional spreadsheet format and replaces it with an intuitive, visual interface that feels more like a heatmap of your team's productivity.
A Timeline Team Timesheet is a visual, color-coded report in ActivityTimeline that displays each team member’s logged hours against their assigned tasks, making it easy to identify workload patterns instantly.
Instead of just listing numbers, this report uses a calendar view to show you how time was spent, day by day. Here’s how it works:
- Time Spent Indicator: Each cell is colored to give you an instant read on a team member's workload. Green means they’ve logged an optimal amount of time, yellow indicates they are underloaded, and red signals they are overloaded compared to their capacity. This allows you to spot potential burnout or availability in seconds.
- Daily and Total Views: The report shows a day-by-day breakdown of logged hours alongside a summary of the total time spent for the selected period (e.g., weekly or monthly).
- Drill-Down for Details: Need more context? Simply click on a team member’s name to see all their worklog details for the period, or click a specific cell to see what specific tasks they logged time against on that day.

This visual approach transforms the timesheet from a static document into a dynamic project management tool, giving you the valuable insights needed for efficient resource allocation.
How Do You Filter and Customize the Timeline View?
The power of the Timeline Team Timesheet lies in its flexibility. You can easily customize the report to get the exact needed data for your review process, whether you’re managing a single agile team or multiple cross-functional squads.
Step 1: Choose Your Scope for Pinpoint Accuracy
ActivityTimeline provides advanced filtering that goes far beyond basic options. You can generate a team timesheet based on a variety of criteria, including:
- Team/People: Focus on a specific team or even a few individual team members.
- Project: Isolate time tracking data for one or more Jira Cloud projects.
- Epic, Category, or Issue: Drill down to see how time is being spent on larger initiatives or specific types of work.
Best of all, these criteria support multi-select filtering, allowing you to generate reports for multiple projects or teams at once.
Step 2: Adjust Your Time Units
You can toggle the view between daily, weekly, or monthly units. A daily view is perfect for granular analysis during a sprint, while a monthly view offers a high-level overview for stakeholder reporting. This flexibility ensures your time tracking reports are always presented at the right level of detail.
Some users find it useful to view time in days instead of hours in the timesheet. ActivityTimeline displays time in minutes, hours, and also in days. To view time in days you need to switch the setting to show workload/time spent in days, not hours.
Step 3: Include Non-Working Days for a Complete Picture
One of the biggest limitations of native Jira time tracking is its inability to account for non-working time. ActivityTimeline solves this by allowing you to include events like vacations, public holidays, and sick leave directly in your timesheets. By enabling this option in the Timesheets Configuration, these absences appear as separate columns, giving you a true and complete picture of your team’s availability and effort.
From Data Overload to Instant Clarity
Stop spending your valuable time trying to make sense of messy, context-free time tracking reports. The Timeline Team Timesheet turns a time-consuming administrative task into a quick, insightful process. It provides an immediate, visual understanding of your team's productivity, workload balance, and overall progress, allowing you to approve timesheets with confidence and make smarter resource management decisions. This isn't just a better report; it's a smarter way to manage your team's most valuable asset—their time.
{{rich-cta-4}}