


- Resource utilization = (hours worked ÷ available hours) × 100. For planning ahead, swap logged hours for scheduled hours.
- For delivery and services teams, 70–85% is the healthy band. Around 80% billable utilization is the most common target. Sustained 100% is a planning failure, not a win.
- Billable utilization only counts client work. Overall utilization counts everything. Compare each against its own target, never against each other.
- Native Jira stores the raw ingredients (worklogs, estimates) but has no concept of a person's available capacity, so it can't produce the percentage. Teams add an app like ActivityTimeline for the report itself.
Someone in a quarterly review asks, "So what's our utilization?" And suddenly three people are looking at three different spreadsheets that don't agree with each other, and the honest answer is somewhere between "about 75%, probably" and a shrug. It's one of the most common situations customers describe to us when they first reach out. Jira knows who logged what and when. It just won't tell you the percentage.
This guide covers the part the spreadsheets keep getting wrong: what utilization actually is, how to calculate it honestly, what number you should be aiming for, and how to get that number out of Jira without exporting anything.
What is resource utilization?
Resource utilization is the percentage of a person’s or team’s available working hours spent on actual project work, usually calculated as hours worked or scheduled ÷ available hours × 100. If a developer has 40 available hours this week and 32 of them are spent on, or scheduled for, real tasks, their utilization is 80%. For resource managers, delivery leads, professional services teams, and anyone responsible for tracking utilization in Jira, it’s a headline KPI because it shows whether paid capacity is being used well, flags overbooking and idle time early, and affects delivery quality, team health, and revenue.
Here’s the distinction most guides skip, and the one that causes most of the spreadsheet arguments: utilization has two directions.
Looking backward, utilization is logged hours divided by available hours. It tells you whether the time you had actually went into the work. This is the number finance asks about.
Looking forward, utilization is scheduled hours divided by available capacity. It tells you whether you’re about to run out of people three weeks from now, while you can still do something about it.
Both are legitimately called “utilization.” They answer different questions, they come from different data (worklogs vs. estimates and bookings), and they should be tracked separately. When two people quote different utilization numbers for the same team, this split is usually why. From there, the rest is deciding what a good utilization rate looks like, how billable utilization differs from overall utilization, where Jira’s native reporting falls short, how to measure both views with ActivityTimeline, and what to change to improve the number without breaking the team.
How do you calculate resource utilization?
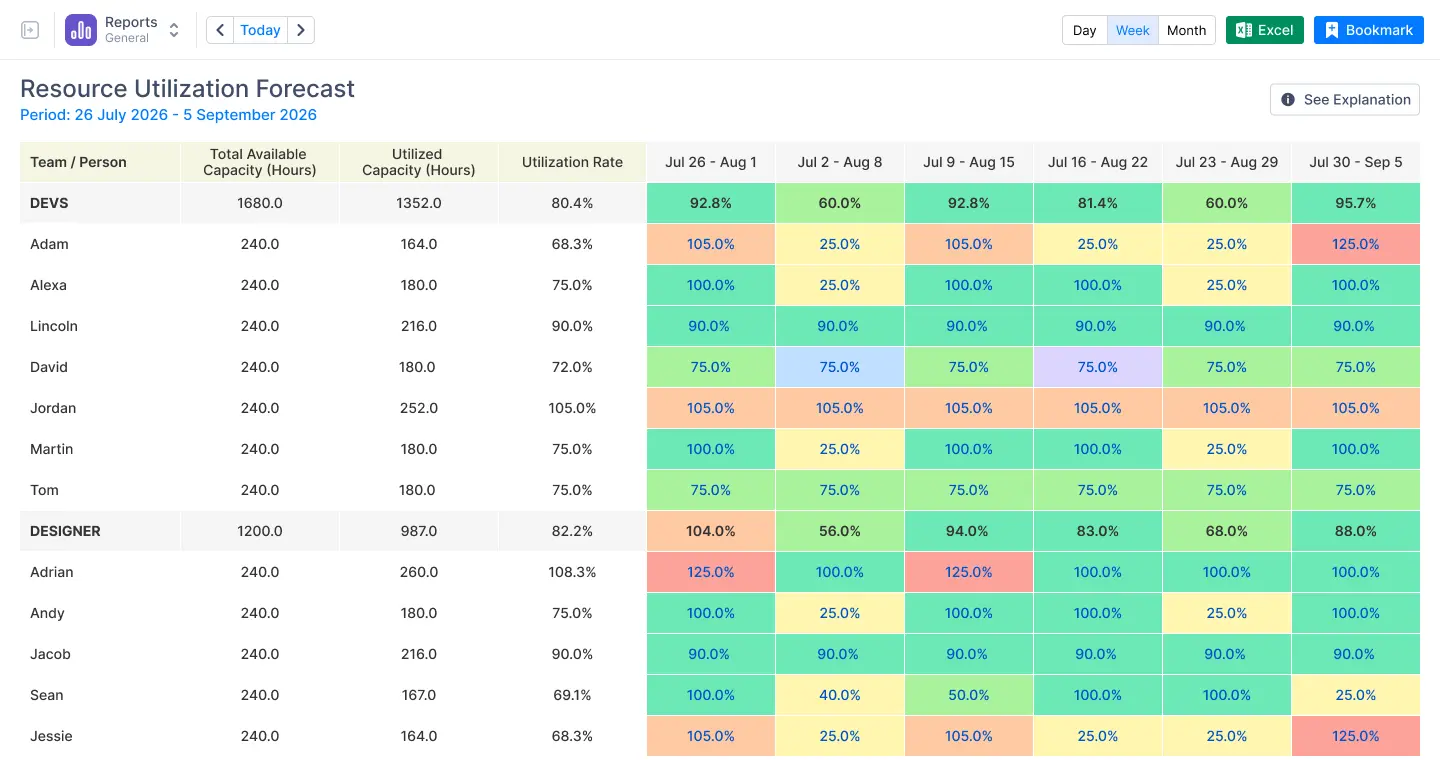
The formula is simple: resource utilization = (hours worked ÷ available hours) × 100. A developer who logs 32 hours of project work in a week where they had 40 available hours is at 32 ÷ 40 × 100 = 80% utilization. For forecasting, the same formula uses scheduled hours instead of logged ones: scheduled hours ÷ available capacity × 100.
The formula is the easy part. Two refinements decide whether your number means anything.
First: available hours are not contract hours. A 40-hour contract with one public holiday in the week means 32 available hours, not 40. Subtract vacations, holidays, sick leave, and part-time schedules before you divide. This is where most homemade spreadsheets quietly break: they divide by 40 for everyone, every week, and then nobody understands why the numbers never reconcile with reality. The person who took Friday off didn't have 40 hours. Pretending they did makes them look underutilized when they were actually fully booked.
Second: decide what counts as the "work" on top. If you count every logged hour, you get overall utilization. If you count only client-facing, chargeable hours, you get billable utilization: billable hours ÷ available hours × 100. Internal meetings, training, admin, and the weekly all-hands are real work, but they're non-billable, and for a services business the billable number is the one that connects to revenue. A consultant with 34 billable hours out of 40 available is at 85% billable utilization, even if their overall utilization is closer to 100%.
Get those two things right (honest availability on the bottom, a clear definition on top) and the rest is arithmetic.
What is a good resource utilization rate?
For delivery and professional-services teams, 70–85% is the healthy band, and around 80% is the most commonly cited target for billable utilization. Sustained 100% is not a stretch goal; it's a planning failure that just hasn't presented its invoice yet. Below roughly 50%, something is broken in either demand or scheduling.
Why not 100%? Because a Jira team's week contains work nobody scheduled: the production bug, the support escalation, the estimate that was off by a day, the meeting that appeared on Tuesday. A plan with zero slack doesn't absorb any of that; it just converts it into overtime. And people who run at 100% for months ship worse work and eventually leave, which is the most expensive utilization problem there is.
Why not relax at 60%? Because at that point you're paying for hours that go nowhere in particular, and you usually can't say where. That's not a people problem, it's a visibility problem, and it's fixable (more on that below).For honest context, industry benchmark research from SPI, reported by Deltek, found that professional-services firms averaged 68.9% utilization in 2024, after three straight years of decline. So if your first real measurement lands below 70%, you're not an outlier. You're average. The interesting question isn't "why is it low?" but "where do the missing hours actually go?" And you can't answer that until you categorize non-billable time.
One more nuance, because this trips up teams comparing numbers across tools: the right target depends on which utilization you're looking at. A scheduled-capacity target can sit higher than a billable target, because scheduled utilization includes legitimate non-billable work. In our own planning guidance we suggest scheduling toward roughly 90% of a team's capacity, keeping about a 10% buffer for the unplanned. That 90% is a scheduling target. It doesn't contradict the ~80% billable target; they're measuring different things. Put them side by side as if they were the same metric and you'll conclude your team is simultaneously overbooked and underperforming, which helps nobody.
| Metric | Formula | Healthy range |
|---|---|---|
| Overall utilization (backward) | logged hours ÷ available hours × 100 | ~70–85% |
| Billable utilization (backward) | billable hours ÷ available hours × 100 | ~70–85%, target ~80% |
| Scheduled utilization (forward) | scheduled hours ÷ available capacity × 100 | up to ~90%, keep a ~10% buffer |
Can Jira measure resource utilization on its own?
What Jira has no concept of is the denominator. There's no field anywhere in Jira for a person's available capacity: no working schedules, no vacations, no public holidays, no part-time arrangements. It also can't aggregate time across multiple projects into a per-person view, doesn't distinguish billable from non-billable work, and doesn't display a utilization percentage anywhere in the product. That means project managers and resource managers can't calculate resource utilization rate or produce resource utilization metrics from native data alone.
So the standard workaround appears: export worklogs to a spreadsheet, maintain availability by hand in a second tab, and rebuild the formulas every time someone joins, leaves, or books a holiday. It works for about a month. Spreadsheets also struggle to preserve planned utilization versus actual utilization, surface utilization trends, or show reliable workload distribution for active projects. Then the spreadsheet drifts from reality, people stop trusting the number, and the KPI quietly dies until the next quarterly review resurrects it.
To be fair to Jira: it was built to track issues, and it tracks them well. Utilization is a people-and-capacity question, and that's simply a different data model. Which is why teams that need the number usually add project management tools or resource management software as a dedicated resource utilization tool and resource utilization software to improve resource utilization, support efficient resource allocation, and plan future projects.
How to measure resource utilization in Jira with ActivityTimeline
Looking backward: utilization from logged work
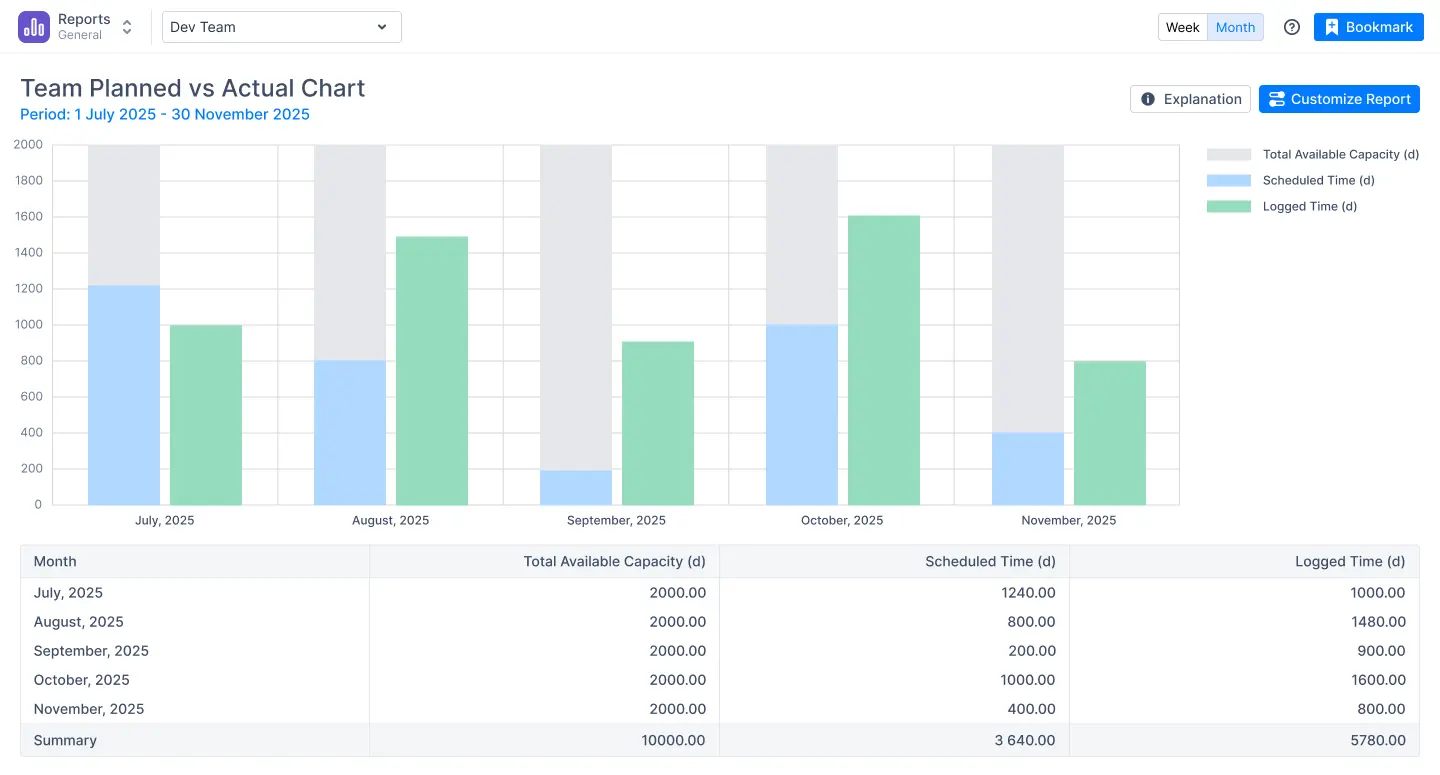
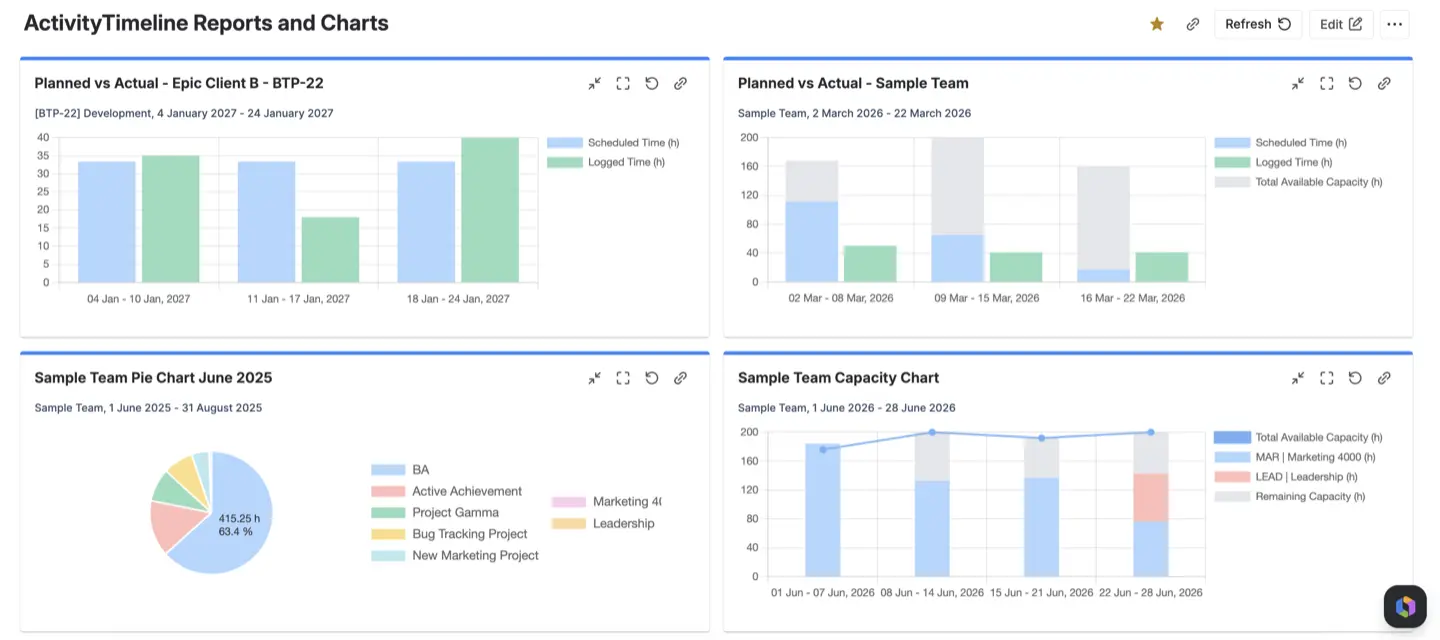
The honesty check on top of that is the Planned vs. Actual report, which provides valuable insights to help teams manage utilization and improve project estimates: planned hours next to logged hours, per person or per team, for any period. It helps project managers and resource managers compare planned utilization with actual utilization for individual team members and teams. If the plan said 36 hours and the worklogs say 41, that gap is your unplanned work made visible. Teams that watch this one report for a few sprints usually stop arguing about whether estimates are "wrong" and start seeing where reality consistently diverges from the plan.
Looking forward: scheduled utilization and forecast
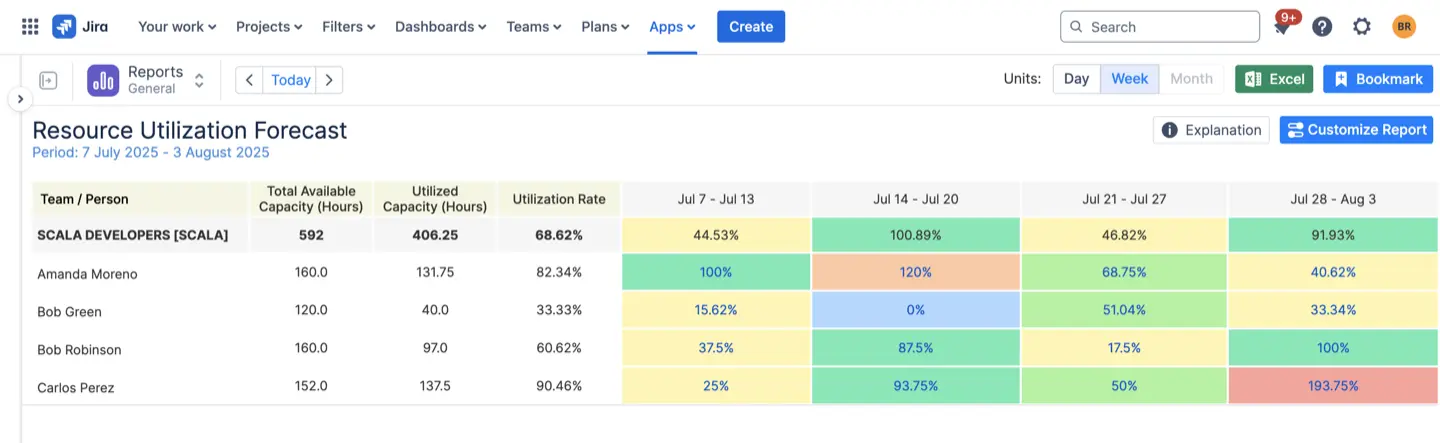
That forward view helps maintain utilization at more optimal utilization rates before overload happens.
The point of this report is timing. An overloaded week that surfaces three weeks in advance is a scheduling conversation. The same week discovered on Monday morning is an apology.
The at-a-glance layer: charts and dashboards
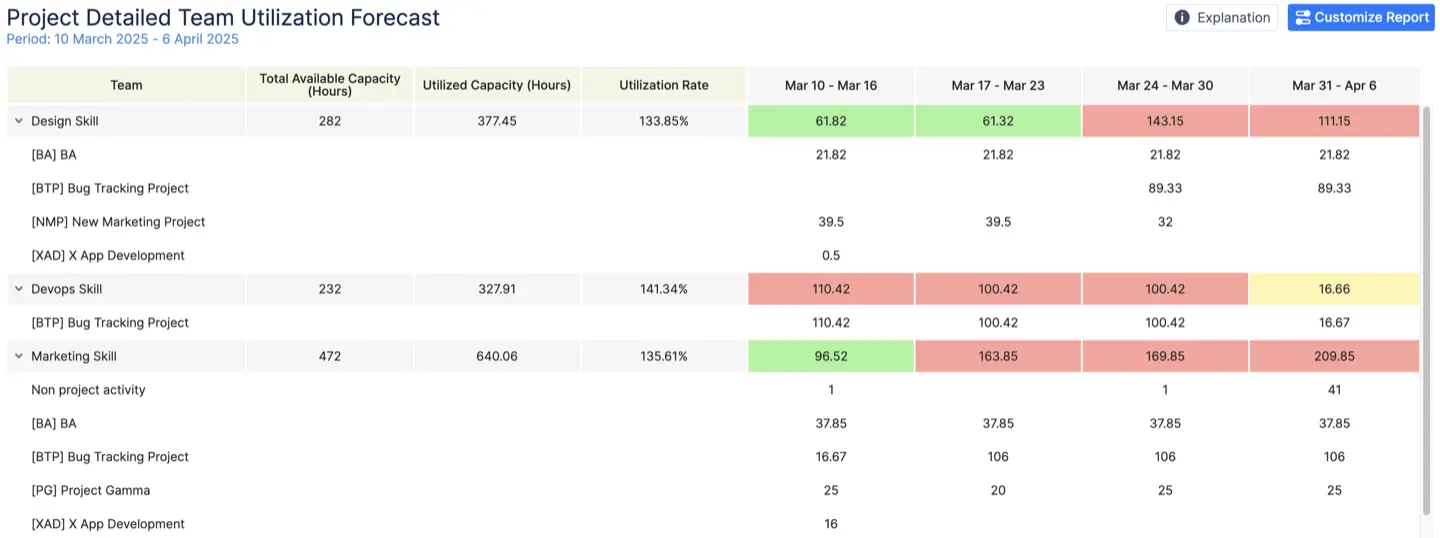
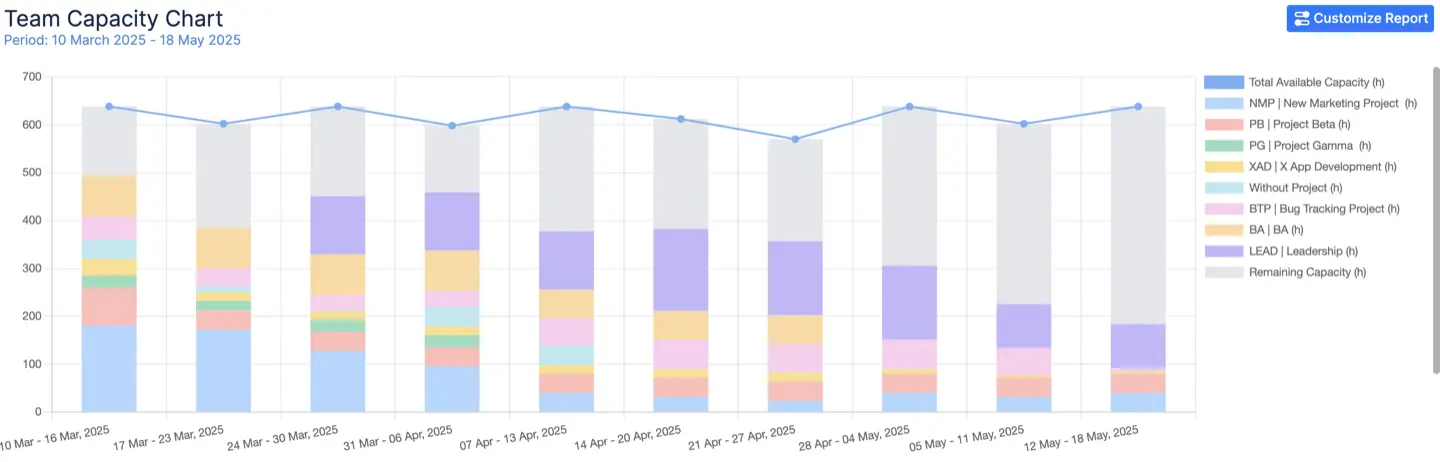
The Team Capacity Chart shows total available capacity (the sum of individual capacities, minus non-working time like days off and holidays, plus any overtime), utilized capacity (from remaining estimates, daily estimates, or story points on assigned tasks, plus bookings, placeholders, and calendar events), the remaining capacity, and the utilization rate as a percentage, broken down week by week or month by month. Together, these act as resource utilization metrics that help teams spot utilization trends. A real example from one of our own walkthroughs: a team that had utilized 580.8 of 880 available hours for the month, roughly two-thirds, with close to 300 hours still open for new work. That works as a practical resource utilization example for team-level capacity decisions. That's a hiring conversation and a sales conversation in one screenshot.

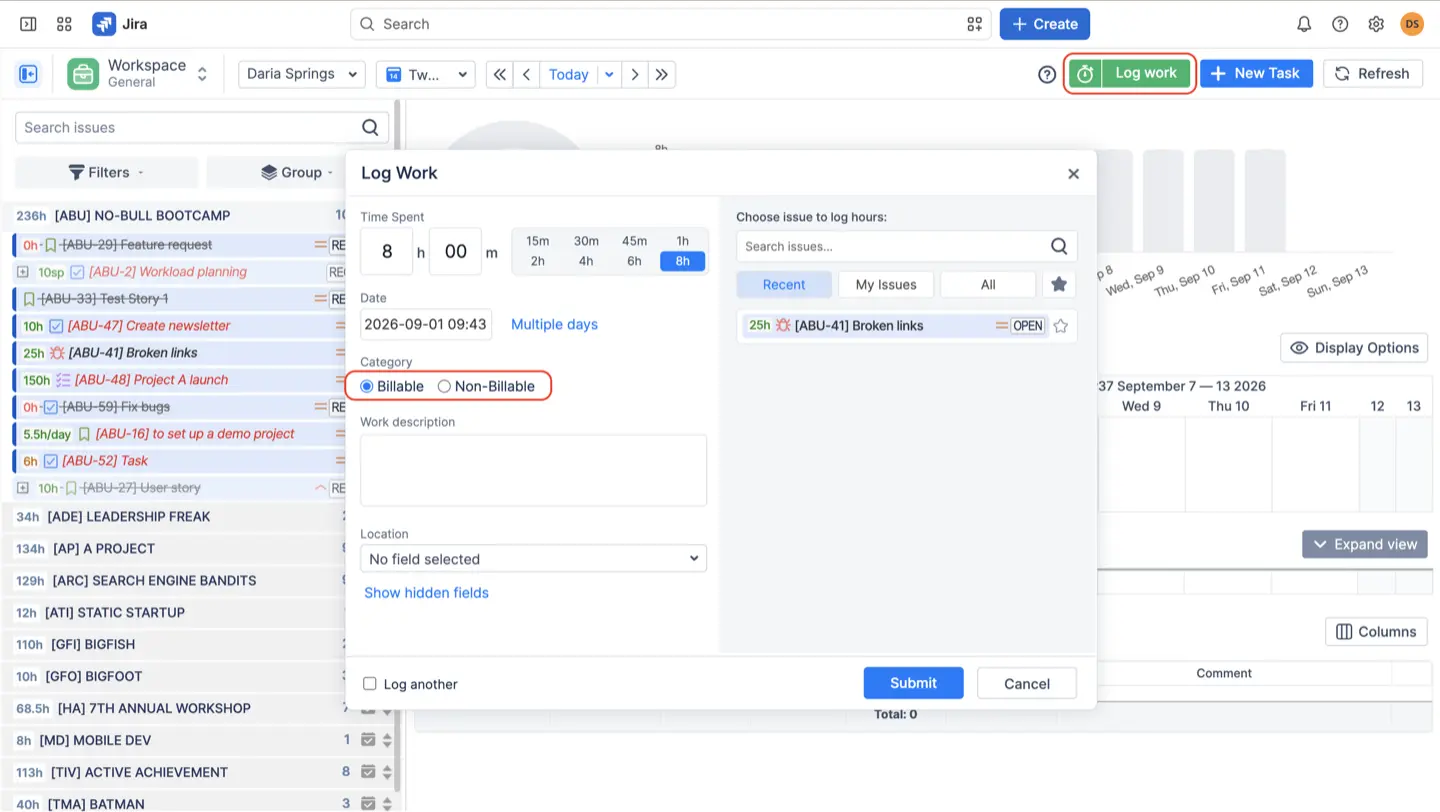
Splitting billable from non-billable
How do you improve a low utilization number?
- Fix the availability data first. If holidays, vacations, and part-time schedules aren't in the system, every utilization number downstream is fiction. This one step alone usually moves the reported number several points, because people who were "underutilized" turn out to have been on leave.
- Categorize before you cut. A team at 65% isn't lazy; its hours are going somewhere you can't see. Mark non-billable work honestly for a month before deciding anything. Tracking non billable utilization separately from revenue generating work is what reveals where time really goes. Often the finding is 20% of capacity going to internal ceremonies, and that's a calendar decision, not a performance one.
- Rebalance across teams, not within them. The overloaded team and the underutilized one usually exist in the same company at the same time. Cross-team visibility is what lets you move work sideways instead of pressuring the busy team to somehow log more, which leads to more efficient resource allocation, better workload distribution, and more proper utilization.
- Use the forecast to fill gaps ahead, not to punish gaps behind. Last month's 68% already happened. Next month's 68% is still negotiable, if you can see it coming.
- Set the target per metric. ~80% billable, up to ~90% scheduled, and say so out loud, so nobody quietly chases 100% of anything. Resource utilization vs capacity utilization is a useful distinction here, because they are related metrics but not interchangeable.
After a few cycles of this, teams usually notice the same thing we did: a utilization report never made anyone work more. It shows you where the plan and reality disagree, and that disagreement is where the fixable problems live.
If your utilization number currently lives in a spreadsheet that one person maintains and nobody quite trusts, ActivityTimeline has a 30-day trial.


