
{{tl-dr}}
Here’s a scenario every project manager knows too well: a high-priority project gets the green light. The project plan looks solid, tasks are assigned, and everything seems on track. Fast forward two weeks, and your star developer is drowning, buried under tasks from three different active projects. Your timeline slips, stress skyrockets, and you’re stuck in a fire drill, reallocating work at the last minute. The problem wasn't the work; it was the complete lack of foresight.
You were blind to the impending workload collision because your resource management tools were showing you the past, not the future. This is where most project management strategies fail. To break the cycle of reactive chaos, you need more than a task list; you need a predictive engine. Enter the ActivityTimeline Resource Utilization Forecast Report—the tool that turns your Jira data into a clear, actionable vision of the future.
Why Your Current Resource Planning is Broken
If your resource management process feels like a constant game of whack-a-mole, you're not alone. Without a forecasting tool, you're just reacting to problems as they appear. This reactive approach has steep costs: missed deadlines, team burnout, wasted billable hours, and a constant state of low-grade panic.
You can't achieve effective resource utilization by looking at a static Jira board or a spreadsheet. Those tools don't show the dynamic, cross-project workload distribution that quietly sinks projects. You might see that a team member has ten tasks, but you have no idea if that represents 10 hours of work or 100. This lack of accurate data makes efficient resource allocation impossible and turns your capacity planning into pure guesswork.
{{rich-cta-1}}
How to Predict Your Team’s Workload with Precision
It’s time to stop guessing and start seeing. The ActivityTimeline’s Resource Utilization Forecast Report is the definitive solution for project managers who need to move from reactive to predictive planning.
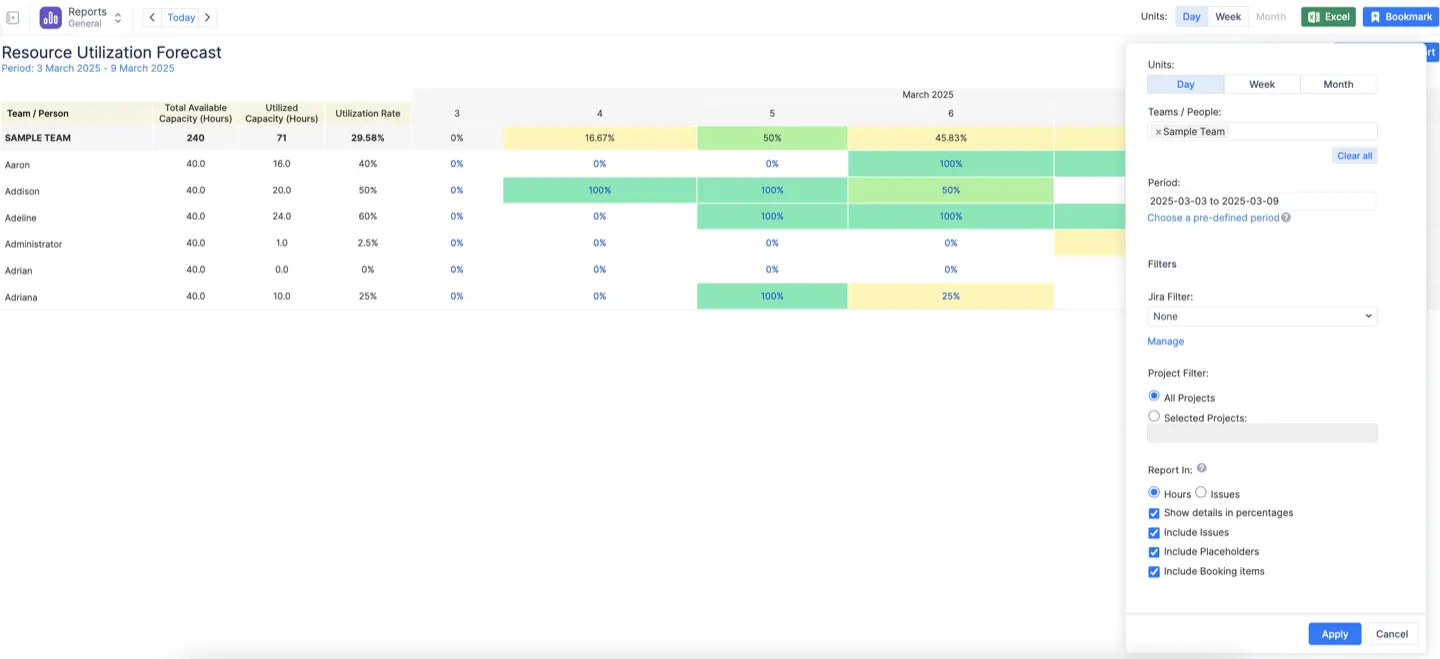
A Resource Utilization Forecast Report is a predictive tool in ActivityTimeline that projects your team's future workload based on remaining time estimates from Jira tasks and other scheduled events. It’s not a historical summary; it's a forward-looking analysis of your team’s committed work. The report pulls the Remaining Time Estimate directly from your Jira issues, combines it with scheduled custom events like Bookings and Placeholders, and projects this data over a defined period. This gives you a clear view of planned utilization for both individual team members and entire teams.
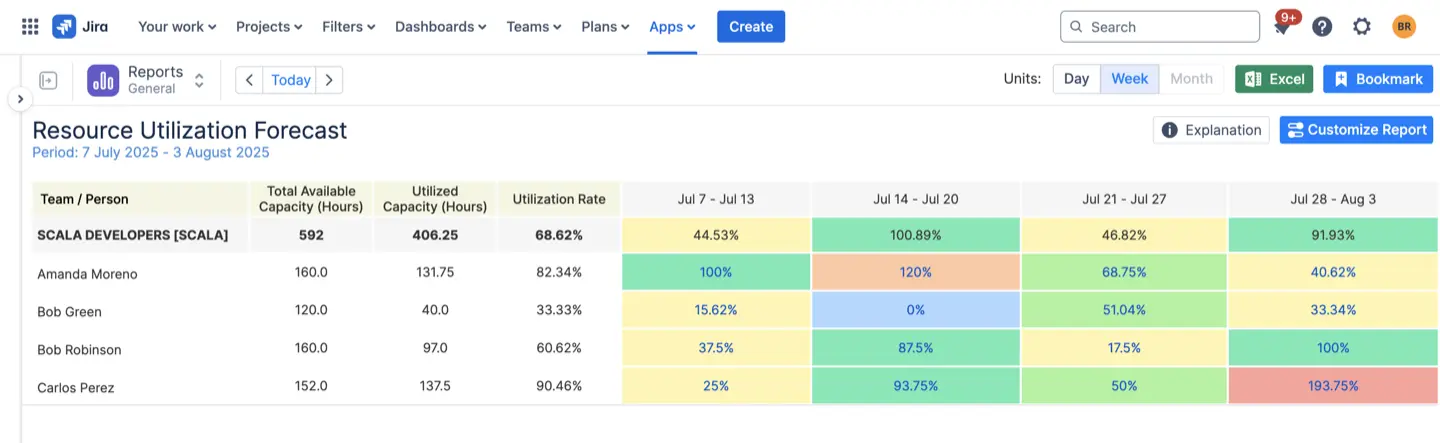
The report is built on a few simple but powerful key metrics:
- Total Available Capacity: This is the total number of available hours a person or team has to work, accounting for their standard schedule and any planned time off.
- Utilized Capacity: These are the scheduled hours already committed to tasks and events.
- Utilization Rate: This is the core of the resource utilization formula—a percentage showing how much of your team's available capacity is already booked.
How to Turn Utilization Data into Smarter Decisions
Having valuable insights is great, but acting on them is what drives results. The Resource Utilization Forecast Report is designed to be immediately actionable, helping you identify potential risks and opportunities long before they impact your timeline.
Identifying the Red Flags
The report uses intuitive color-coding to signal trouble. If you see high utilization rates—for example, a team member is booked at 120% capacity in three weeks—that’s a bright red flag. It’s a clear indicator of impending burnout and a major risk to your project deadlines. You can spot these bottlenecks weeks in advance, giving you ample time to adjust the plan.
Spotting Hidden Availability
Conversely, low utilization rates (often shown in yellow) highlight untapped resource capacity. See a developer at only 40% utilization for the next sprint? That’s your opportunity. You can confidently pull in tasks from new projects, address backlogged items, or tackle non billable tasks like training without disrupting your current workflow. This is what optimal resource utilization looks like in practice.
Taking Action in the Planner
The report and the Planner module work hand-in-hand. When you spot an issue in the forecast, you can jump directly into the Planner's visual timeline to resolve it.
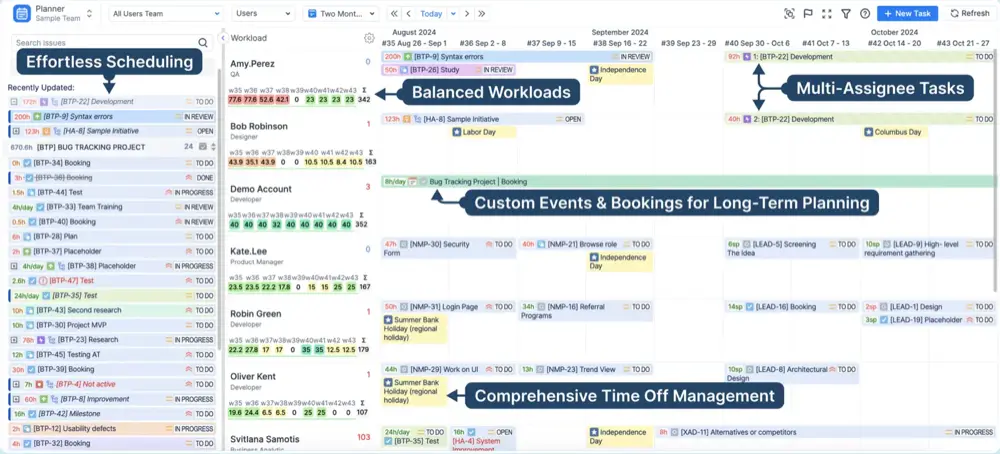
For instance, the Resource Utilization Forecast Report shows your lead engineer is over-allocated next week. You can immediately go to the Planner, see their full schedule, and drag-and-drop a few tasks to another qualified team member who has the resource availability. This simple action balances the workload distribution and keeps the project moving smoothly. It’s a fluid, real-time approach to resource scheduling that spreadsheets could never match.
From Reactive Firefighter to Predictive Strategist
Effective resource management isn't about having all the answers; it's about having the right data to ask the right questions. The Resource Utilization Forecast Report transforms you from a reactive manager putting out fires to a predictive strategist who sees problems coming and solves them before they start.
This isn't just another report to add to your administrative tasks. It's a strategic resource management software that provides the visibility needed for effective resource utilization. It ensures your team's productivity remains high, your profit margins are protected, and your projects are consistently successful.
{{rich-cta-4}}