Jira reports let you see your project’s heartbeat. Are you hitting your milestones? Is your team overburdened? These reports give you real-time answers to those questions so you can act fast.
ActivityTimeline steps in to take Jira’s reporting game to the next level. It adds what Jira's built-in tools can't match: advanced reporting, resource planning, and timeline visualizations — all synced with your Jira data.
Introduction to Jira Reports
What are Jira reports?
Jira reports are a powerful tool that helps teams analyze and visualize their project data, track progress, and make data-driven decisions.
Reports in Jira provide a comprehensive overview of project performance, enabling teams to identify trends, patterns, and areas for improvement.
With Jira reports, teams can create custom dashboards, track key metrics, and gain valuable insights into their project’s health and status.
Benefits of using Jira reports
Using Jira reports offers numerous benefits, including:
- Improved Project Visibility and Transparency. Get a clear view of your project’s progress and status at any time.
- Enhanced Decision-Making Capabilities. Make informed decisions based on real-time data and insights.
- Increased Productivity and Efficiency. Identify bottlenecks and streamline workflows to boost team performance.
- Better Resource Allocation and Planning. Allocate resources more effectively by understanding workload and capacity.
- Enhanced Collaboration and Communication. Share insights and progress with your team to keep everyone aligned.
- Ability to Track Progress and Identify Areas for Improvement. Monitor key metrics and identify areas that need attention to ensure continuous improvement.
Overview of Jira reporting capabilities
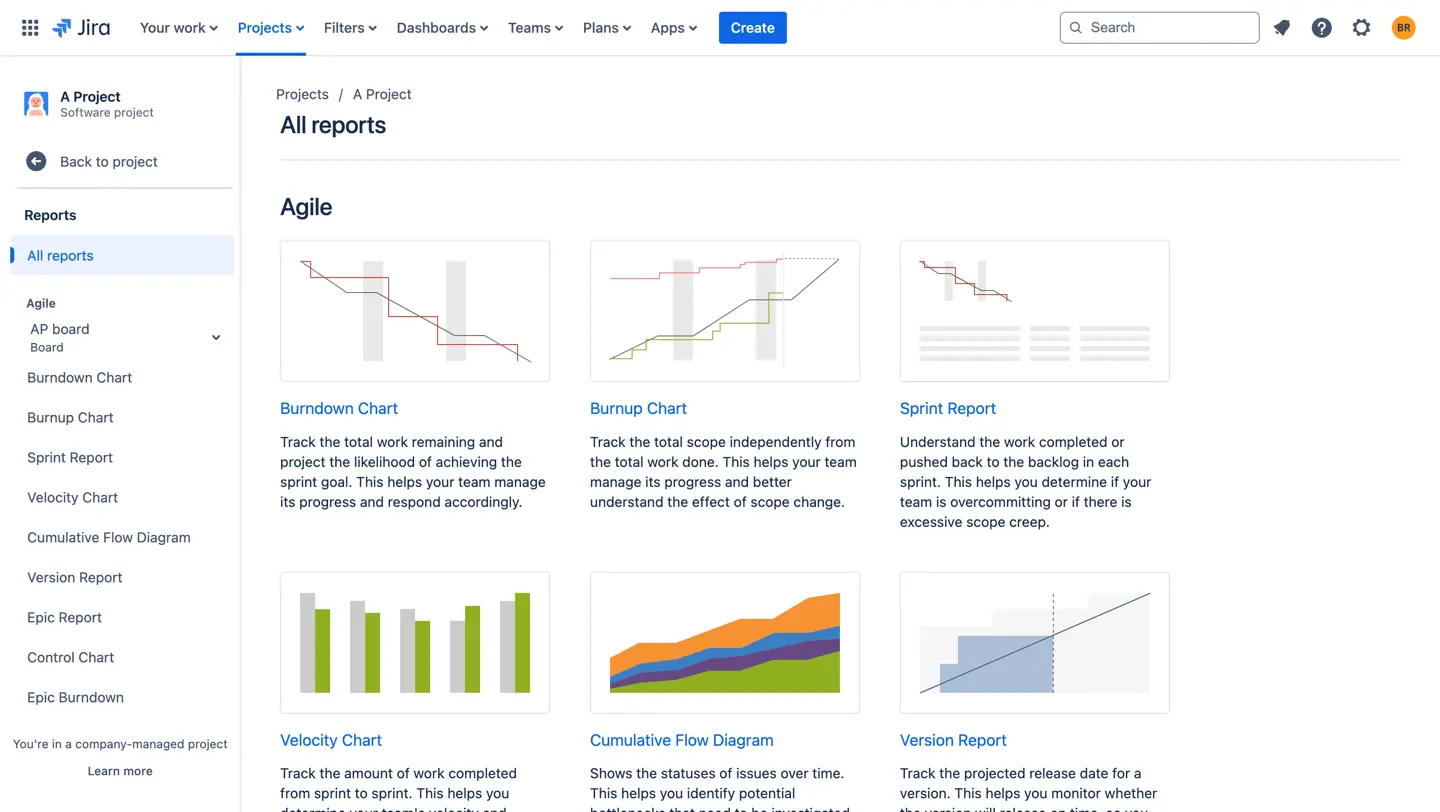
Jira offers a wide range of reporting capabilities, including:
- Agile Reports for Scrum and Kanban Teams. Track sprint progress, team velocity, and workflow efficiency with reports like Burndown Charts, Velocity Charts, and Cumulative Flow Diagrams.
- Forecast and Management Reports. Plan future sprints and releases with reports that help you predict future performance and manage workloads.
- Issue Analysis Reports. Analyze issue trends, resolution times, and backlog health with reports like Created vs. Resolved Charts and Average Age Reports.
- Custom Reports and Dashboards. Tailor reports to your specific needs by creating custom dashboards and filtering data to focus on what matters most.
- Integration with External Reporting Tools and Business Intelligence Solutions. Enhance your reporting capabilities by integrating Jira with external tools for deeper insights and advanced analytics.
How to Create a Report in Jira (Step by Step)
Creating a report in Jira takes under a minute once you know where to look. The path differs slightly between Jira Cloud and Data Center:
In Jira Cloud:
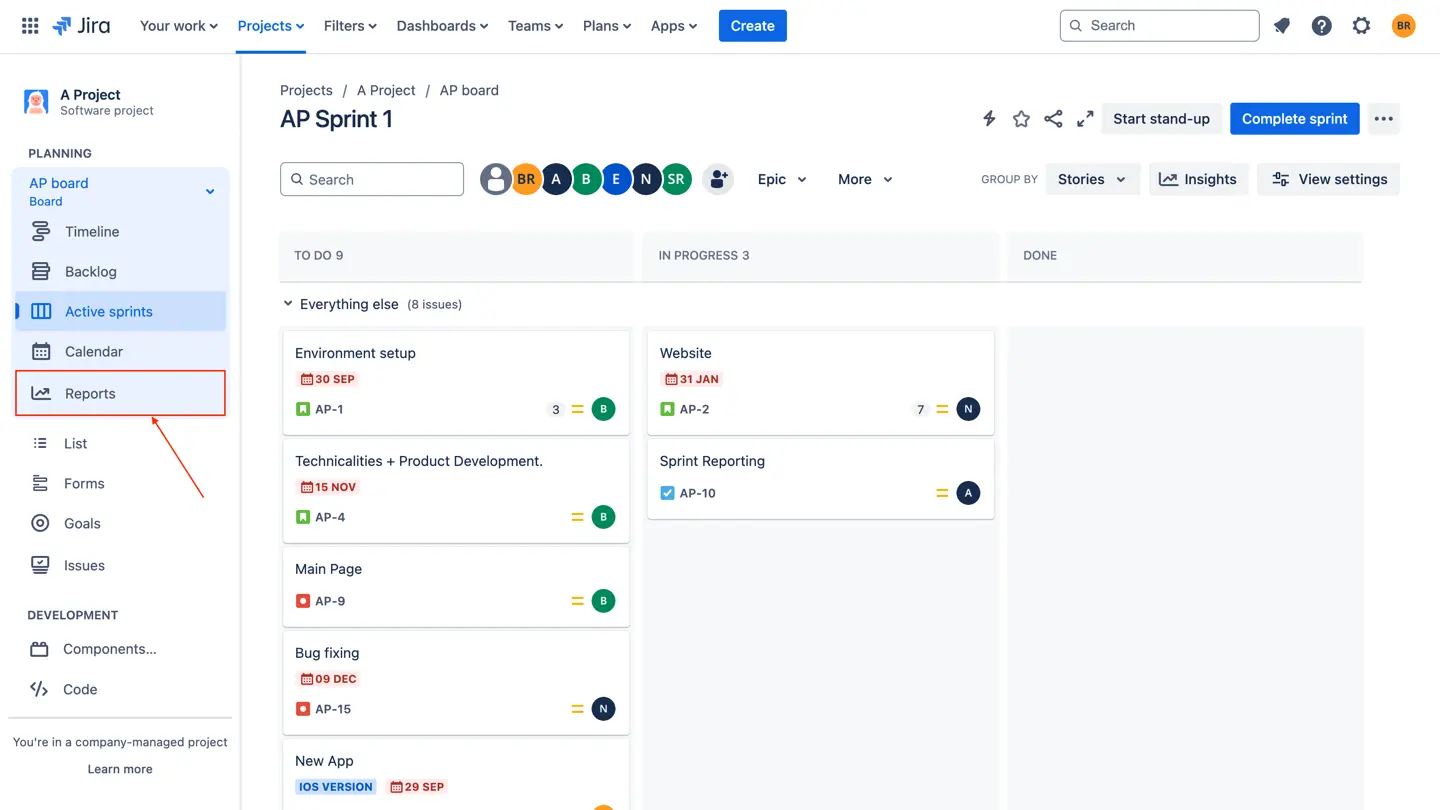
- Open your project and select Reports in the left sidebar.
- Pick a report from the gallery — reports are grouped into Agile, Forecast & management, and Issue analysis.
- Configure the report's parameters (sprint, time frame, or filter, depending on the type).
- The chart generates instantly from live project data. Use Refine report to adjust the date range or scope.
- To share it, add the report as a gadget to a Jira dashboard, or export the underlying issues.
In Jira Data Center / Server:
- Go to your board and click Reports in the board sidebar.
- Use the report switcher at the top to move between Burndown, Velocity, Control Chart, and the rest.
- Configure sprint or date parameters and the chart updates in place.
Tip: dashboard gadgets (covered below) let you pin any report where your team will actually see it — no need to regenerate it every standup.
ActivityTimeline makes reporting even easier by syncing seamlessly with Jira. Think resource reports, time tracking summaries, and capacity planning insights — all without the manual hassle. To build one, open ActivityTimeline → Reports, pick a template like the Resource Utilization Forecast, choose your team and period, and click Create — then export to Excel or bookmark it for one-click reuse. Find more details on our Reporting product page.
ActivityTimeline makes reporting even easier by syncing seamlessly with Jira. Think resource reports, time tracking summaries, and capacity planning insights—all without the manual hassle.

Types of Jira Reports and Their Uses
Jira’s reports are like a Swiss Army knife for agile teams—they give you the insights you need to plan, execute, and optimize your projects.
If you’re managing a Kanban board, sprinting through Scrum, or analyzing issue trends, Jira’s reporting toolkit has something for you. Various reports for Scrum teams help track sprint goals, improve retrospectives, and manage workload effectively.
Let’s dive into the different types of reports, explore some of the most used ones and how they can supercharge your workflow.
Agile Reports for Kanban Teams
Cumulative Flow Diagram
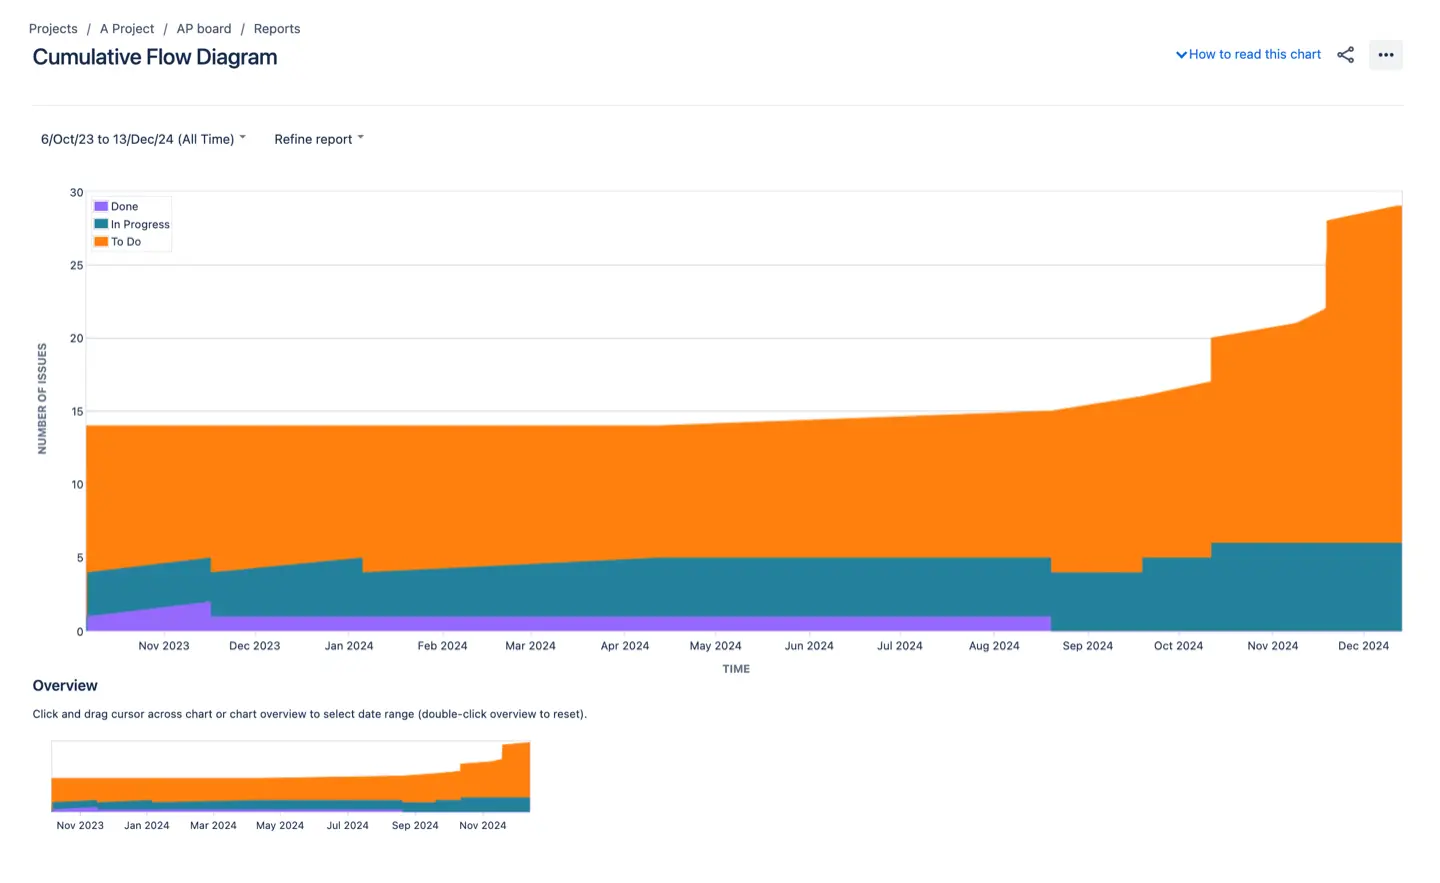
Think of this as your workflow’s health check. A Cumulative Flow Diagram (CFD) shows how tasks move through different stages of your process. Are issues piling up in one column? That’s your bottleneck screaming for attention. Use this report to streamline workflows and keep things moving smoothly.
Control Chart
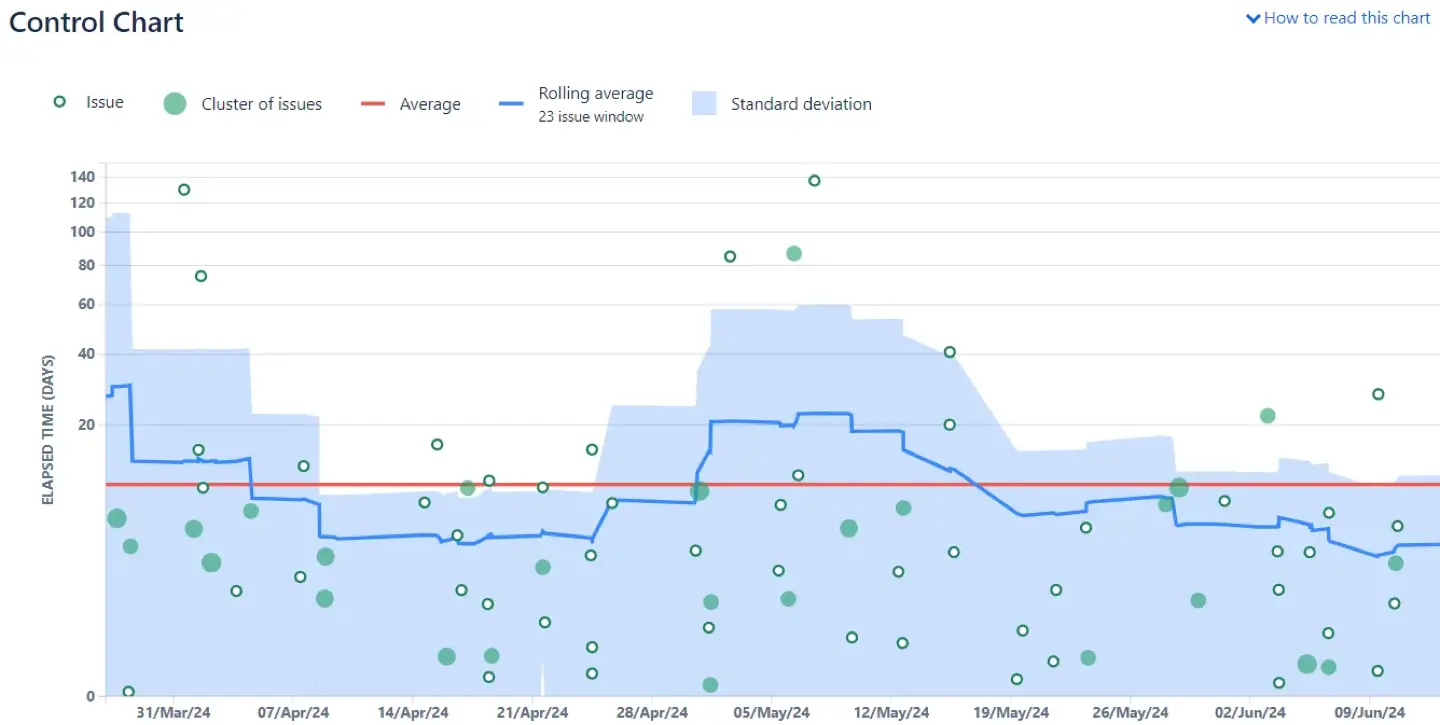
The Control Chart is your crystal ball for predicting performance. It measures cycle time—how long it takes for tasks to go from start to finish. Want to improve consistency or hit deadlines more accurately? This chart is your go-to for identifying patterns and tweaking processes.
Agile Reports for Scrum Teams
Burndown Chart
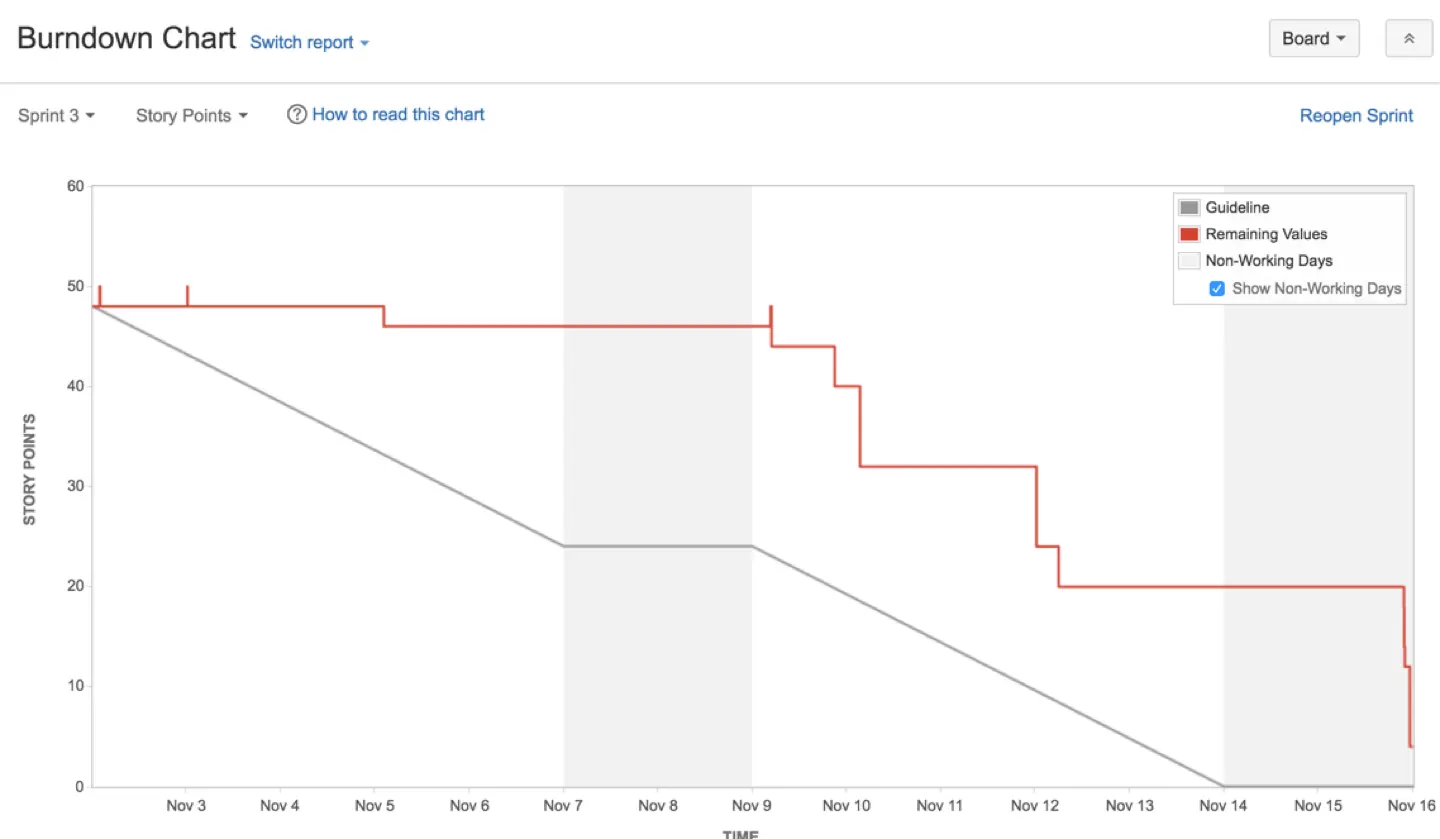
The Burndown Chart is the ultimate sprint tracker. It shows how much work remains versus how much time you’ve got left. Are you on track to meet your sprint goals, or is scope creep derailing things? With this chart, you can adjust plans mid-sprint and stay on target.
Velocity Chart
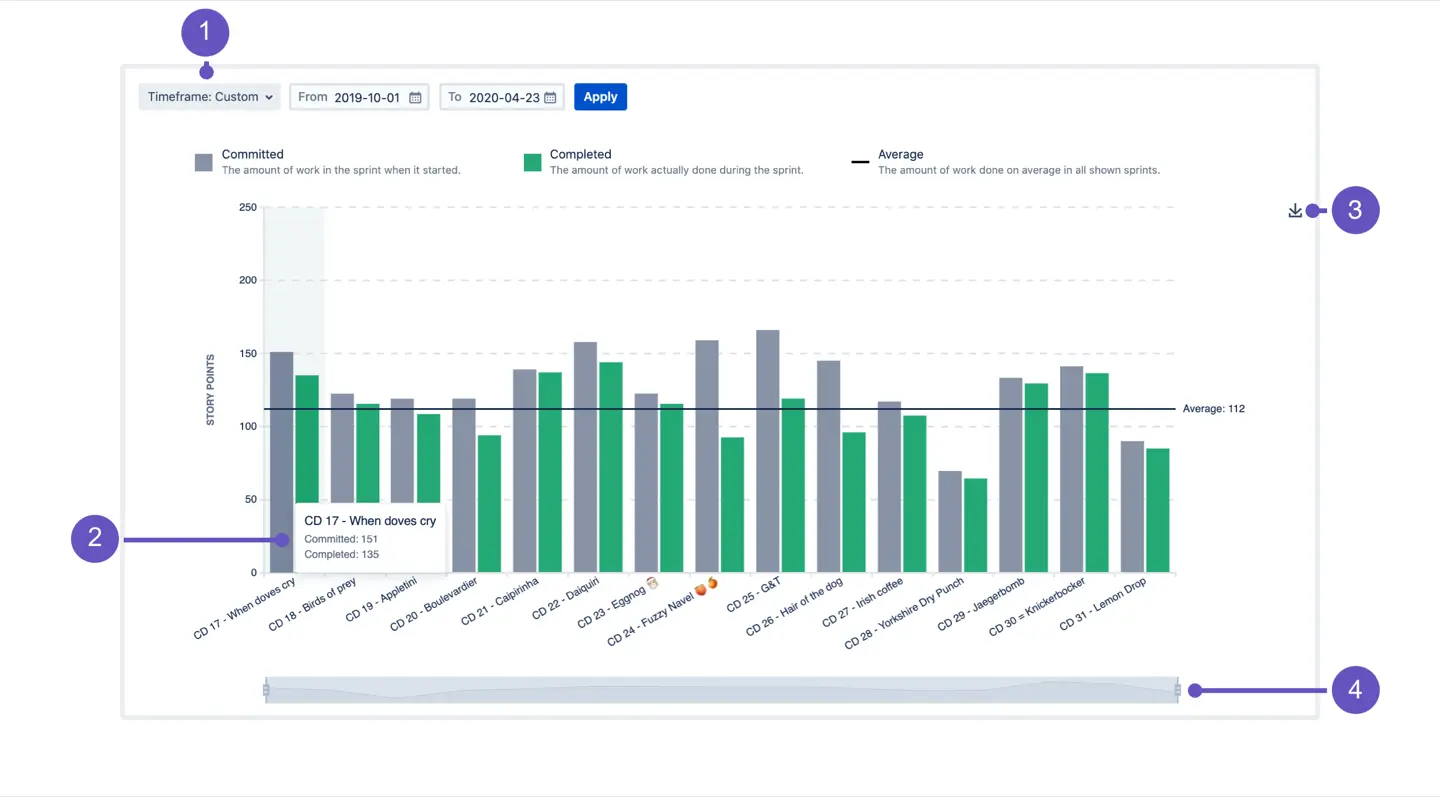
Need to forecast future sprint capacity? The Velocity Chart analyzes your team’s historical performance to estimate how much work they can realistically handle. It’s perfect for planning ahead and setting achievable goals.
Sprint Report
The Sprint Report shows what your team completed, what got pushed back to the backlog, and what was added mid-sprint. It's the go-to view for sprint retrospectives — if scope creep or overcommitment keeps derailing sprints, this report shows you exactly where.
Burnup Chart
The Burnup Chart tracks completed work against total scope over time, with each line moving independently. Unlike the Burndown, it makes scope changes visible: if the scope line jumps mid-sprint, you can see precisely when work was added and how it affected the finish line.
Epic Report and Epic Burndown
Working on initiatives bigger than one sprint? The Epic Report shows progress toward completing an epic across sprints, while the Epic Burndown projects how many sprints remain based on your team's pace. Both are ideal for keeping stakeholders honest about delivery dates.
Forecast and Version Reports
Version Report
The Version Report tracks your projected release date for a fix version. It plots completed work against the remaining scope and draws a trend line to the estimated release day — so you know whether the version will ship on time before the deadline arrives, not after.
Release Burndown
The Release Burndown shows work remaining across all sprints in a release. If your team keeps adding scope faster than it burns down, this chart makes the problem impossible to ignore — and gives you the data to negotiate scope or timeline early.
Issue Analysis Reports
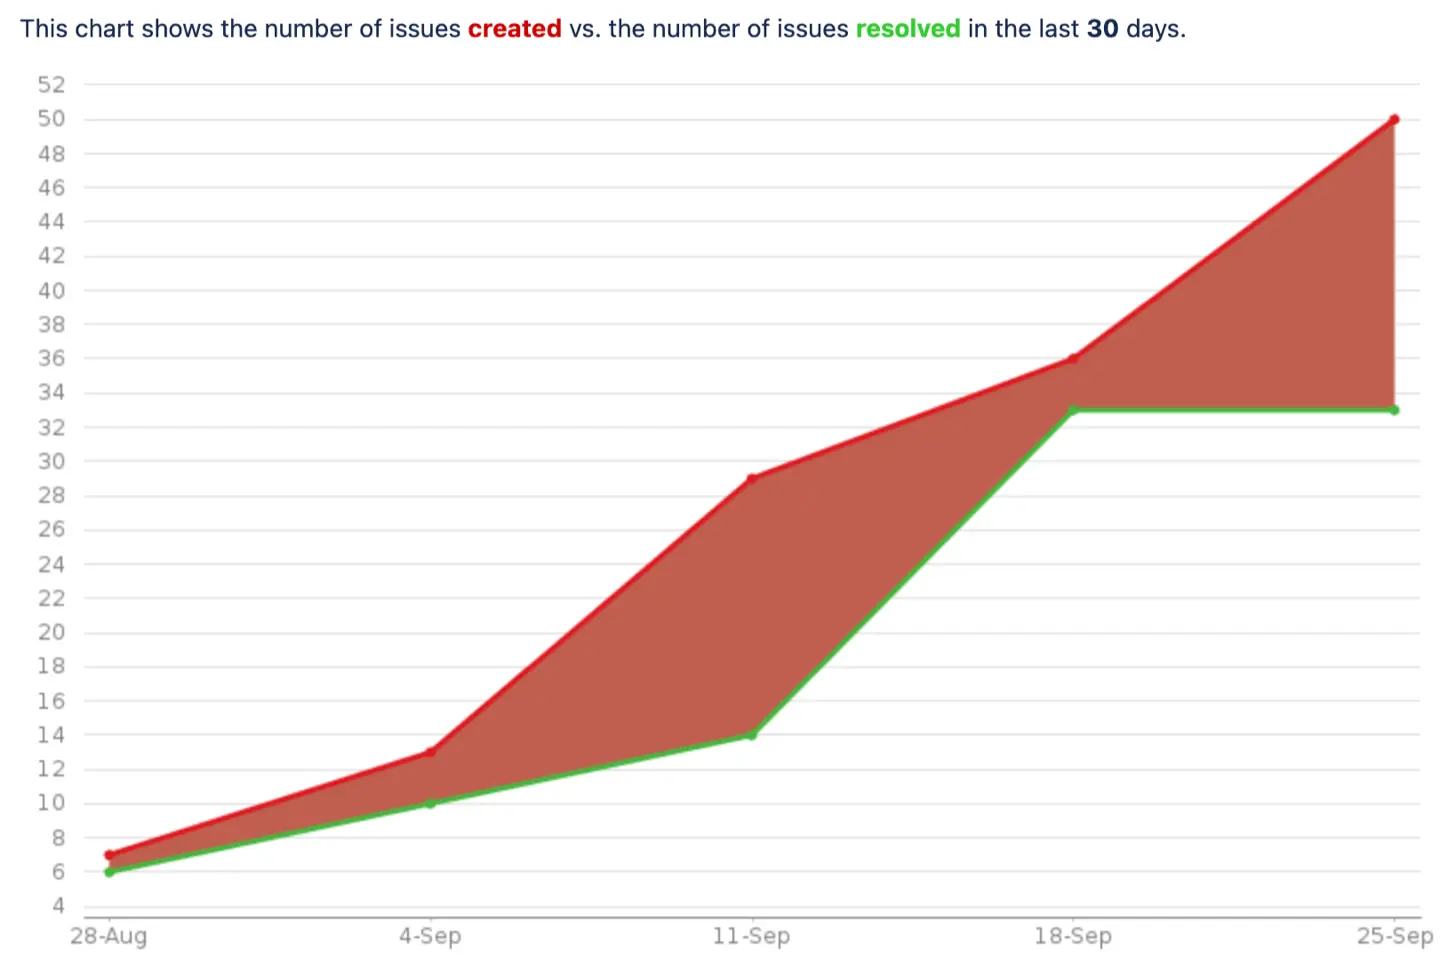
Created vs. Resolved Chart
Are you solving problems as fast as they’re popping up? The Created vs. Resolved Chart compares incoming tasks to completed ones. It’s a great way to see if your team is keeping pace or if issues are starting to pile up.
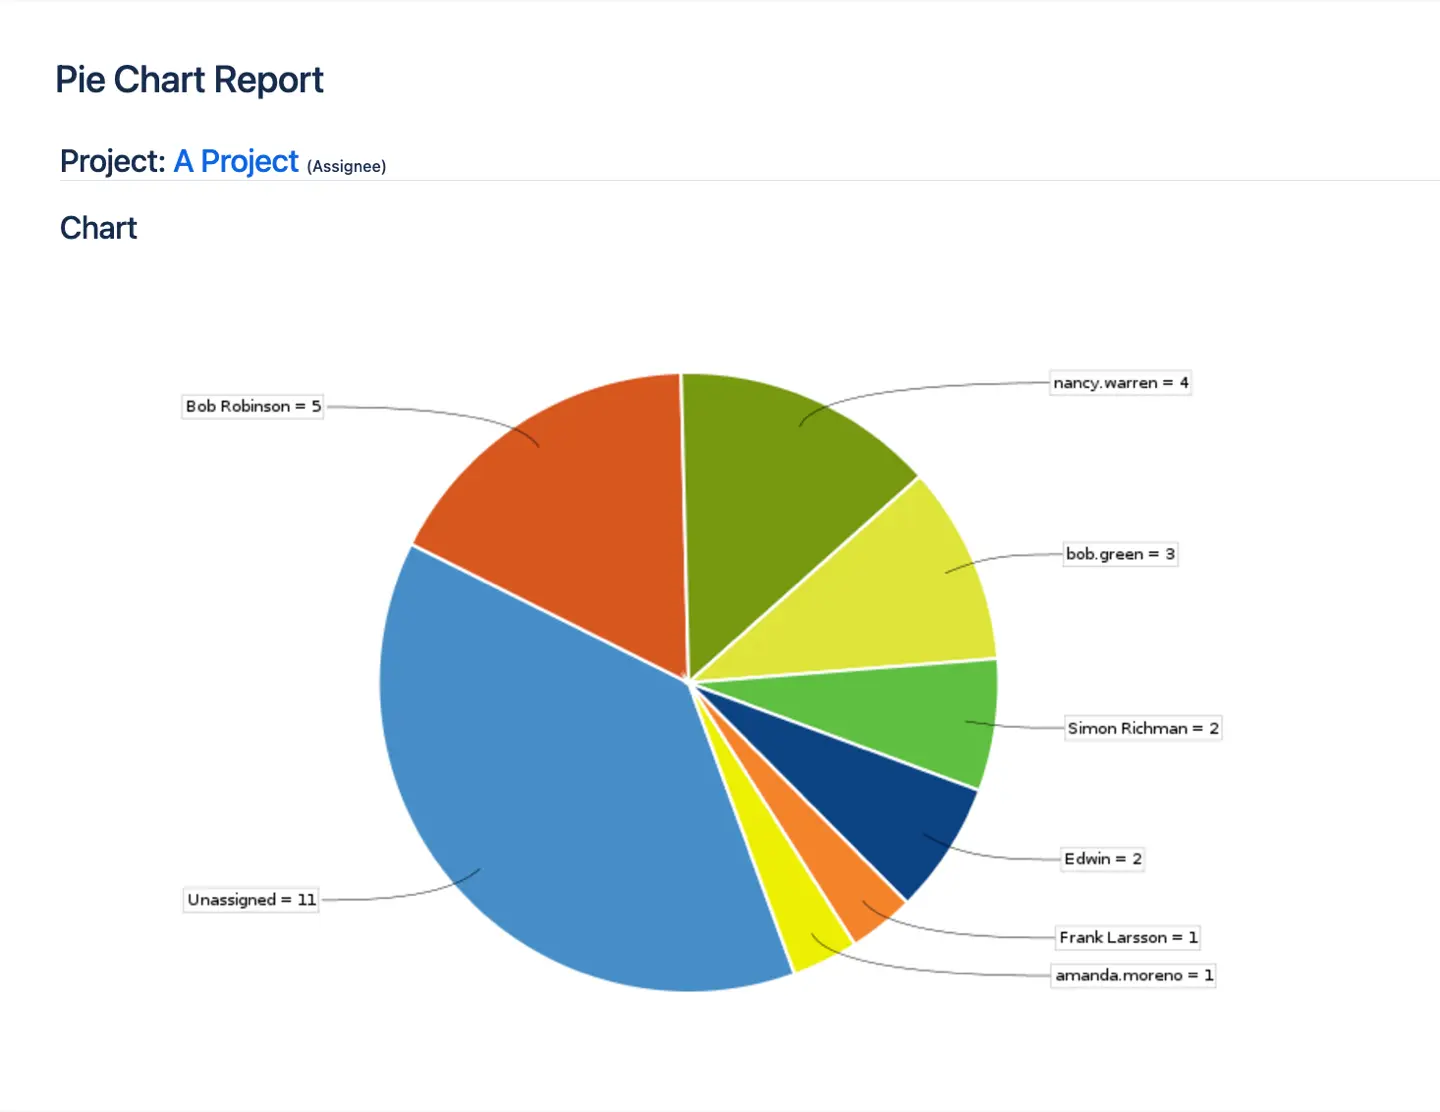
Pie Chart
Want to know who’s doing what? The Pie Chart breaks down issues by assignee, status, or priority. It’s a visual snapshot of your team’s workload and where the focus needs to be.
Average Age Report
How long do issues sit unresolved? The Average Age Report shows the average age of open issues over time. A rising line means your backlog is aging faster than the team can work it — a signal to reprioritize or cut scope.
Recently Created Issues Report
This report shows the rate of incoming issues and how many of them are already resolved. It's a quick pulse check on whether new work is being absorbed or piling up.
Resolution Time and Time Tracking Reports
The Resolution Time Report shows how quickly issues get closed, while the Time Tracking Report compares original estimates against time logged for a version's issues. Together they answer the two questions every manager asks: how fast are we, and how good are our estimates?
Jira Report Examples: Which Report Answers Which Question
- Will we finish the sprint on time? > Burndown Chart
- How much can the team take on next sprint? > Velocity Chart
- Where is work getting stuck? > Cumulative Flow Diagram
- How long do tasks take, start to finish? > Control Chart
- Will this version ship on schedule? > Version Report
- Are issues coming in faster than we close them? > Created vs. Resolved Chart
- Who's carrying the heaviest workload? > Pie Chart (by assignee) — or ActivityTimeline's Resource Utilization Forecast for hours-based capacity
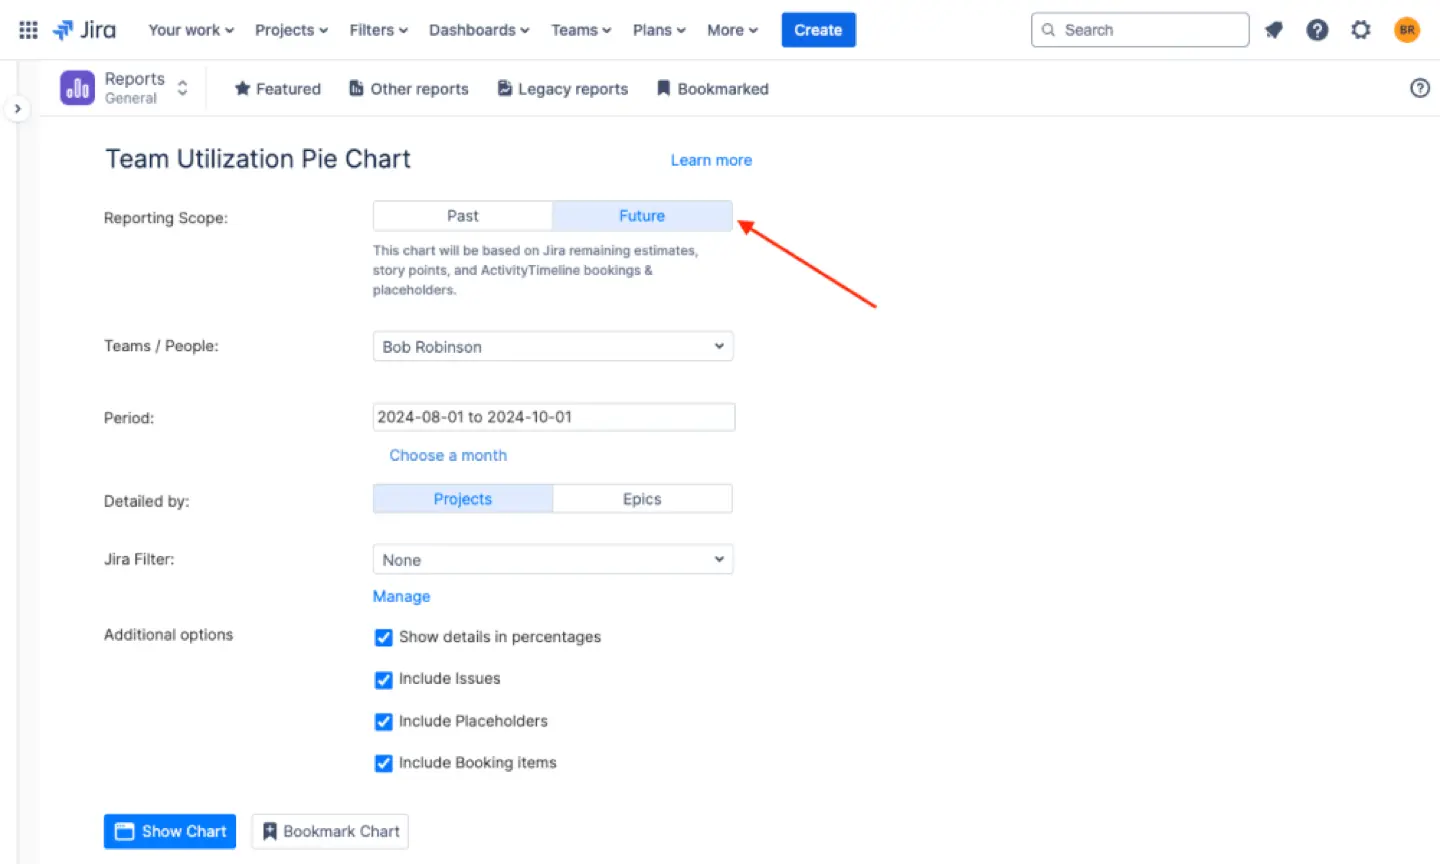
- How was the team's time actually spent? > ActivityTimeline's Team Utilization Pie Chart (past mode, based on worklogs)
Scopes (or Levels) of Jira Reports
Individual reports
Individual reports in Jira provide a detailed view of a specific area of focus, such as a single project, issue, or user. These reports help teams analyze and understand individual performance, track progress, and identify areas for improvement. Individual reports can be used to:
- Track Individual User Activity and Performance. Monitor how team members are performing and identify areas where they may need support.
- Analyze Issue Resolution Rates and Times. Understand how quickly issues are being resolved and identify any delays.
- Monitor Project Progress and Status. Keep an eye on the overall progress of a project and ensure it stays on track.
- Identify Trends and Patterns in Individual Performance. Spot patterns in how tasks are being completed and use this information to improve processes.
Some common individual reports in Jira include:
- Average Age Report. Shows the average age of issues in a project or filter, helping you understand how long tasks are taking to complete.
- Resolution Time Report. Displays the time taken to resolve issues in a project or filter, providing insights into your team’s efficiency.
- Recently Created Issues Report. Lists recently created issues in a project or filter, helping you stay on top of new tasks and prioritize them accordingly.
Dashboards and Gadgets: Your Reporting HQ
Jira dashboards are your command center. Perfect for tracking key metrics across projects, they provide gadgets where you can filter data and focus on what really matters.
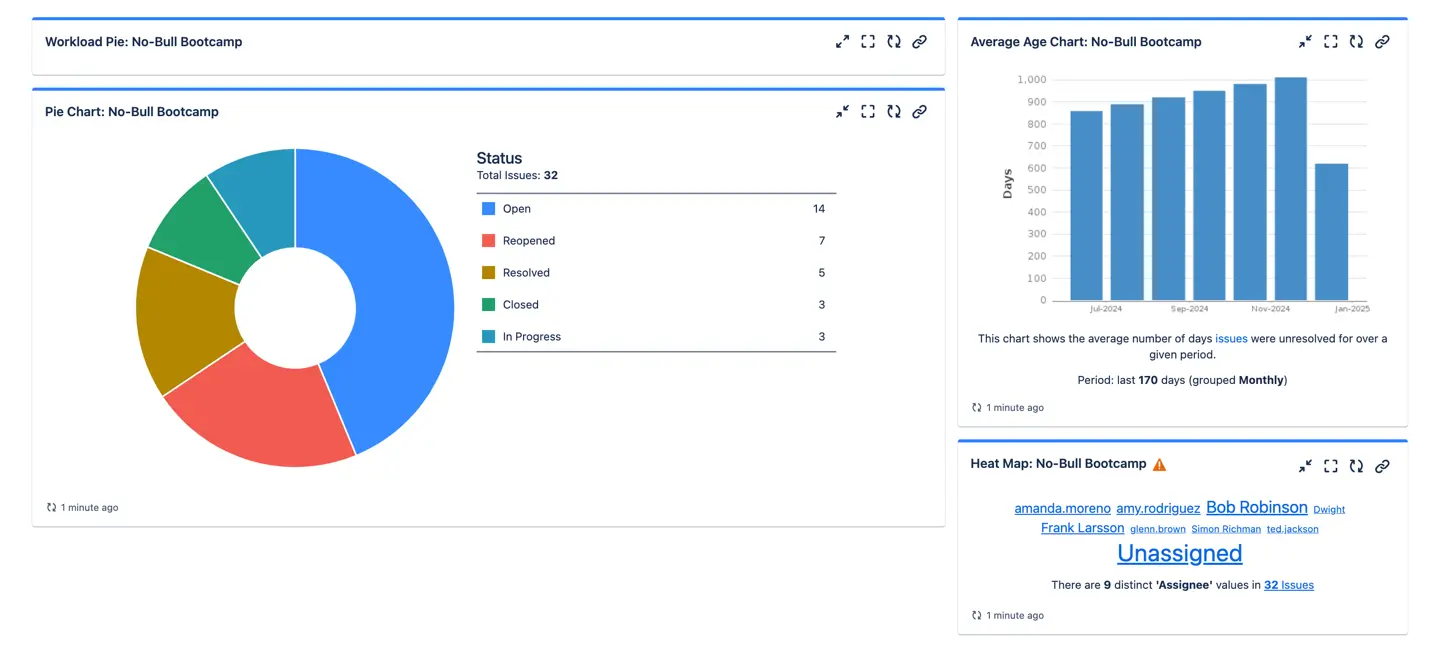
ActivityTimeline’s widgets bring Jira dashboards to life. Picture this: team availability, task timelines, and leave schedules—all visible at a glance. Need to export the data to Excel for your next meeting? One click, and you’re good to go.
Add ActivityTimeline’s reports—like the Team Capacity Chart, Planned vs. Actual Chart, and Team Utilization Pie Chart—as Jira gadgets to your dashboard and configure the settings.
What makes this feature extra cool is the built-in caching. Reports only refresh when you hit the refresh button or revisit the dashboard after a set time. You can even set auto-refresh intervals (daily, hourly, etc.) to keep things up-to-date without hogging resources. This integration lets you visualize your data where you need it most, bringing clarity to your Jira workspace with a single click (learn more the the Jira Visualization article.)
Advanced Reporting with Plugins
Jira’s reports are great for surface-level insights, but they often fall short when it comes to:
- Resource utilization
- In-depth time tracking
- Forecasting future workloads
Using control charts and cumulative flow diagrams can help determine future performance by analyzing cycle and lead times, allowing teams to make informed, data-driven decisions.
Jira reporting add-ons can significantly enhance your project management game, but they’re not without their challenges. Here’s a quick breakdown of the benefits and drawbacks to help you decide if they’re right for your team:
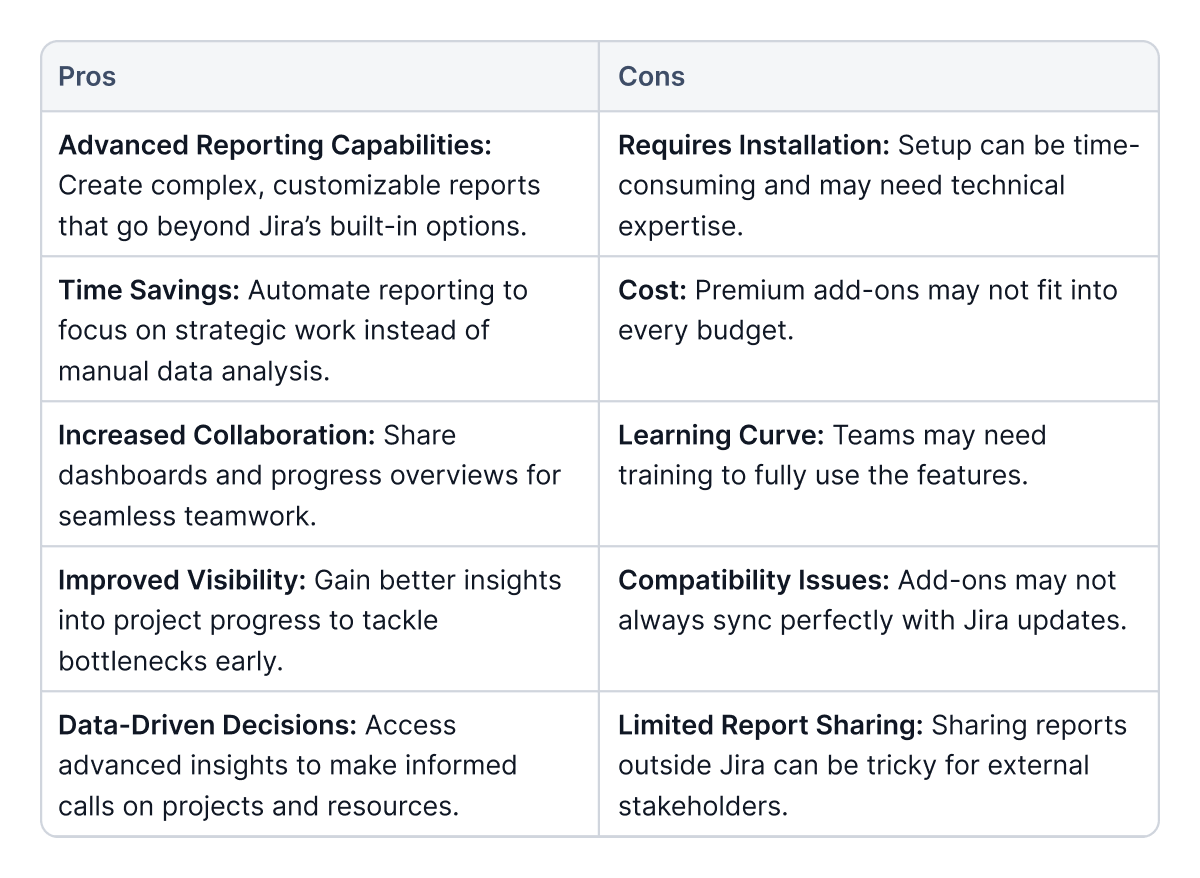
ActivityTimeline fills these gaps with features tailored to project managers who need a clear view of their team’s capacity and availability. ActivityTimeline takes things to the next level with advanced resource and capacity management insights. Here’s how it makes reporting smarter, more actionable, and downright easier:
- Improved Features: ActivityTimeline offers advanced planning, scheduling, and workload management capabilities along with reporting. We listen to customer requests and add what you ask us about in upcoming releases.
- Excellent Support: ActivityTimeline has consistently received praise for its intuitive interface and superior customer support. We work with teams big and small to deliver excellent service.
- Seamless Integration: We implemented a two-way integration with Jira so that you don’t worry about compatibility. ActivityTimeline also integrates seamlessly with other frequently used tools like Jira Plans or Tempo, which makes migration easier than ever.
Whether you’re managing projects in Jira or Jira Service Management, this add-on keeps everything in sync and up-to-date.
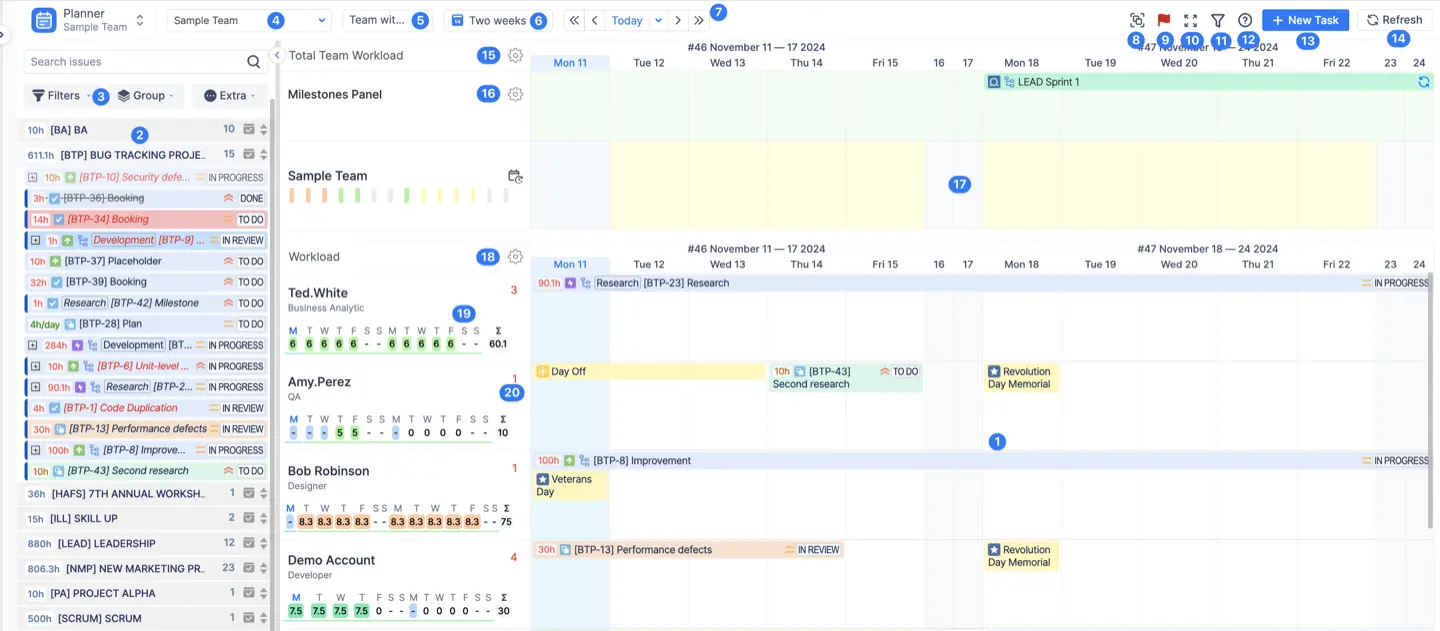
ActivityTimeline’s Planning Dashboard
Think of it as your mission control. You get a crystal-clear, cross-project view of your team’s workload in one place. And when it comes to reporting, ActivityTimeline really shines with features that help you navigate time tracking and resource utilization effortlessly:
Timesheet Reporting Made Easy
Jira’s time-tracking reports can feel limited, but ActivityTimeline steps up with customizable, detailed timesheet reports. Building these reports is like snapping together Legos—pick your values, generate the report, and you’re good to go.
Here’s a breakdown of what you can do:
- Progress Timesheets
Quickly compare logged hours to required work hours. A built-in progress bar keeps you updated on non-working days and how close you are to meeting goals. - Team Timesheets
Choose from templates to see summaries or dig deeper into data grouped by project, issue, epic, or even custom fields. - Detailed Timesheets
Need to get granular? Add custom Jira fields to track every angle of task, project, or user performance.

Advanced Reporting Features
ActivityTimeline doesn’t just enhance Jira’s reports—it adds serious muscle to your reporting toolkit.
Resource Reports and Charts
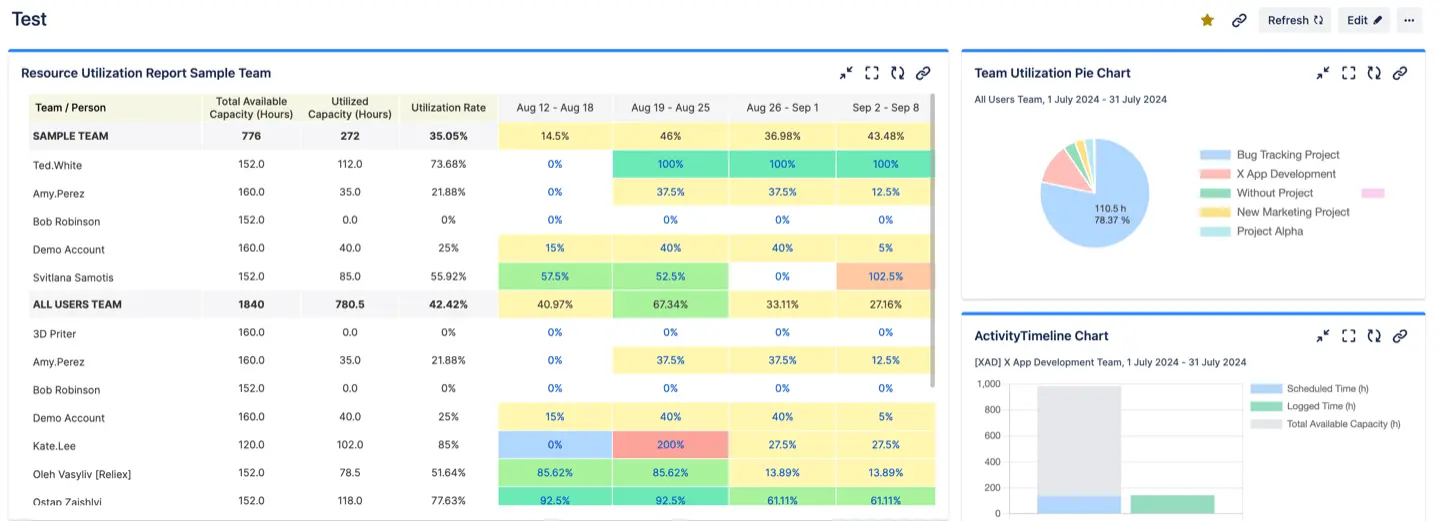
Want to know how busy your team really is? Resource Reports track who’s working on what, using Jira’s remaining time estimates to calculate workloads and capacity. They’re perfect for spotting under- or overutilization. You can view them as Excel reports or check out the web reports for a quick overview. Learn more about resource and capacity management in the Capacity Planning 2026 article.
Key highlights include:
- Team Utilization Pie Chart
- Capacity and Availability Reports (for teams, individuals, and skills)
- Detailed Worklog Reports
Project Reports and Charts
Keep tabs on your project’s progress with Project Reports. They pull data from Jira to show how close you are to hitting goals. Whether you’re tracking a project, epic, or initiative, these charts help you see where things stand:
- Project Progress Reports
Leave & Event Reports
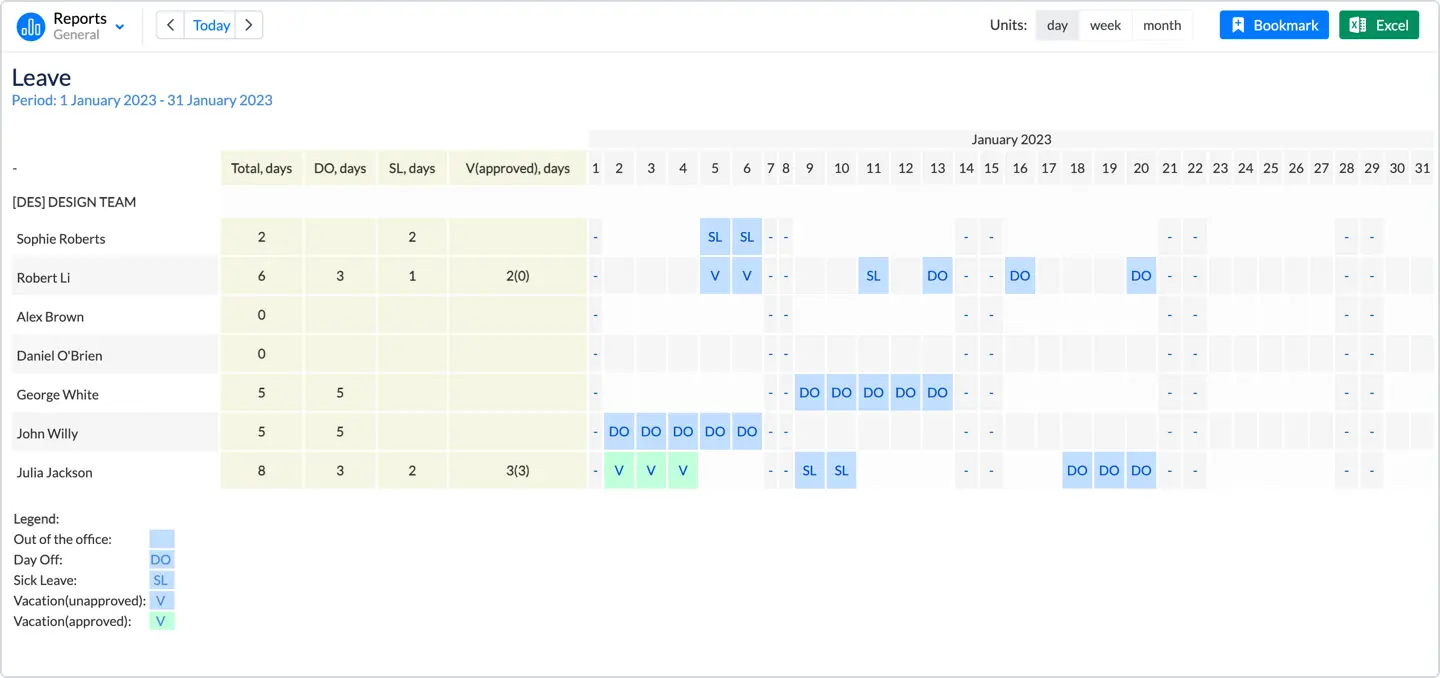
Tracking time off? Leave Reports make it easy to monitor vacations, sick days, and other time-off events by team or user. Get a clear view of:
- Who’s out and when with the Leave Report
- Vacation statuses by user in the Vacations Report
Best Practices for Jira Reporting
Keep It Relevant
Don’t overload your team with Jira reports. Stick to the ones that matter, like the average age report to track how long issues are sitting, or a quick pie chart report to get an overview. Focus on what helps you hit goals—skip the noise and keep it simple with the project progress and outstanding work reports.
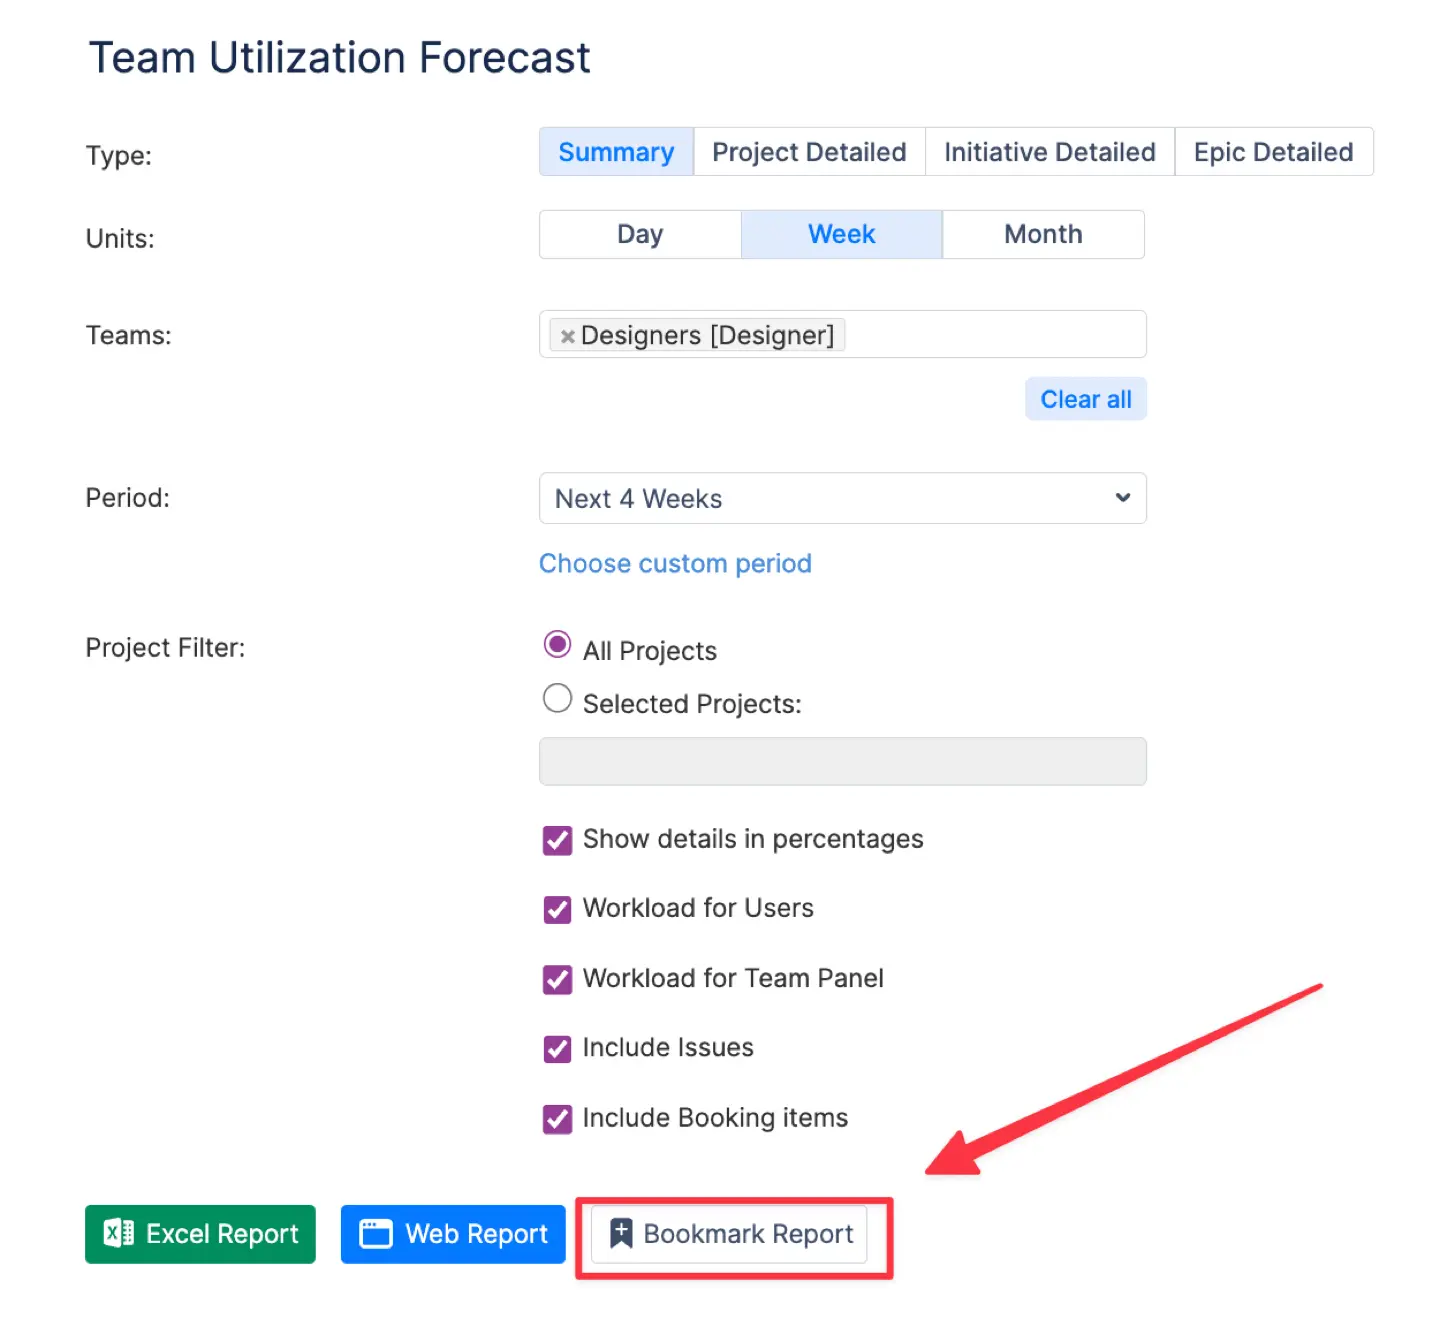
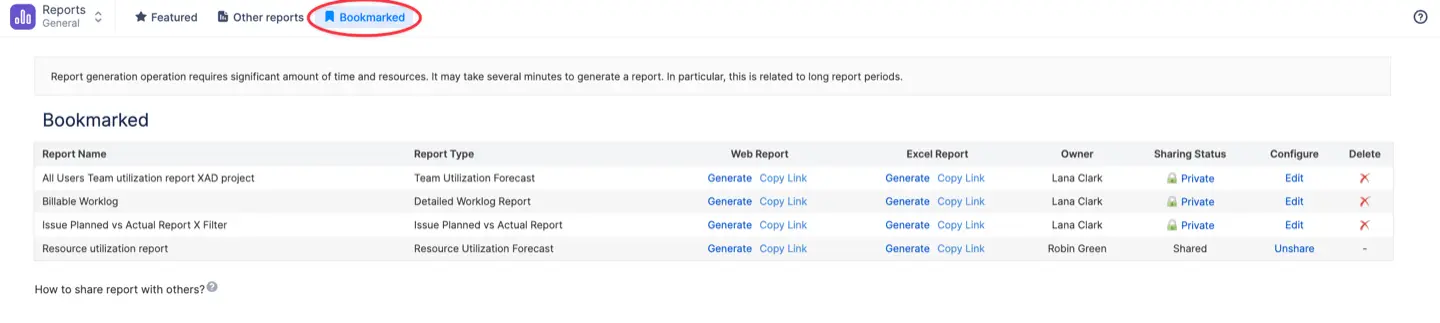
In ActivityTimeline, you can use Bookmarked reports to always stay focused and save time on reporting. Store already created and configured reports for later use. Creating a bookmarked report is easy—when configuring your report, click ‘Bookmark report’ and it will be added in a shortcut list:
Customize Your Reports with Custom Reports
Jira doesn't have a full custom report builder out of the box — customization happens through dashboards, gadgets, and JQL filters, or through reporting apps. We've covered the native options in depth in our full guide to Jira custom reports. With ActivityTimeline, you can filter by things like story points or fix version, or group data by custom fields to focus on what matters most.
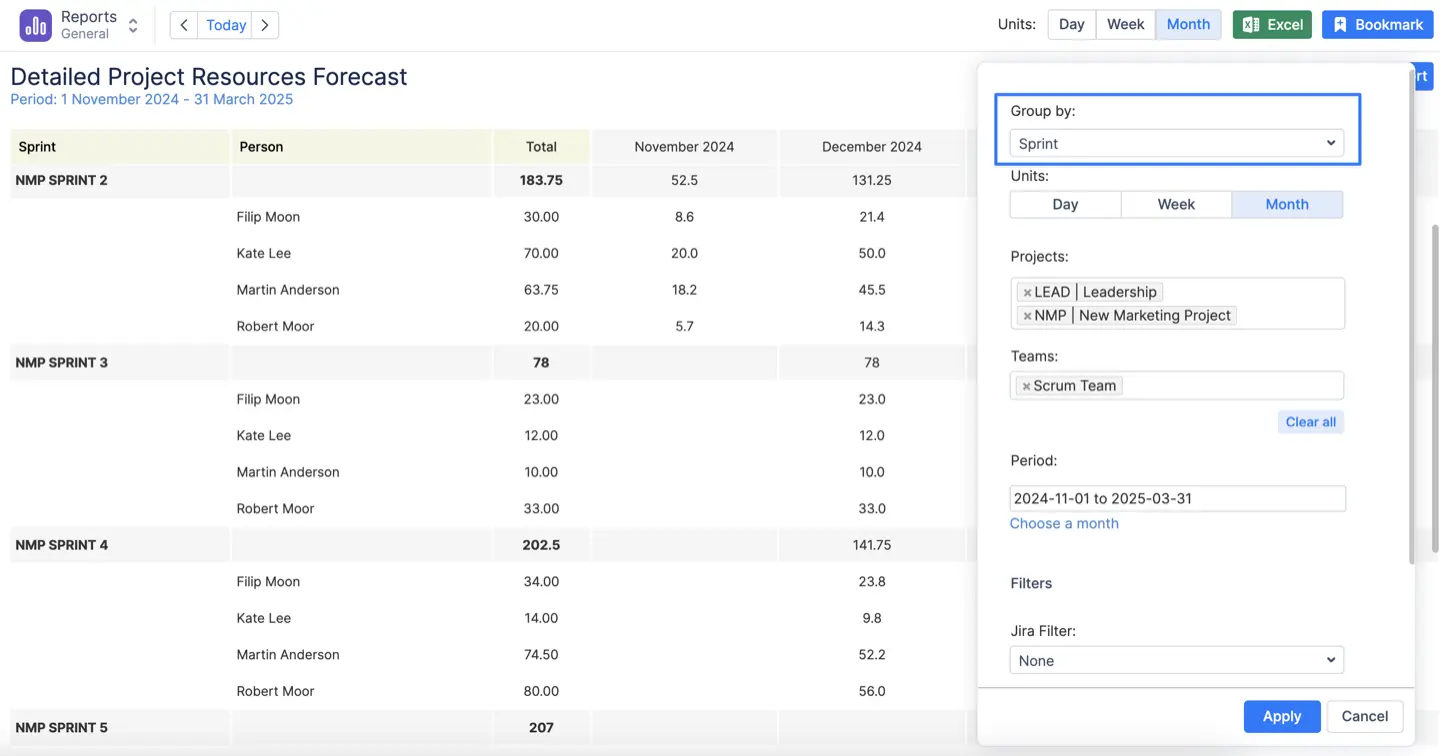
Visualize past and future capacity while using ActivityTimeline. Whether it’s a resolved report or detailed issue analysis, tailor it to your team’s needs.
Export Data for Deeper Insights
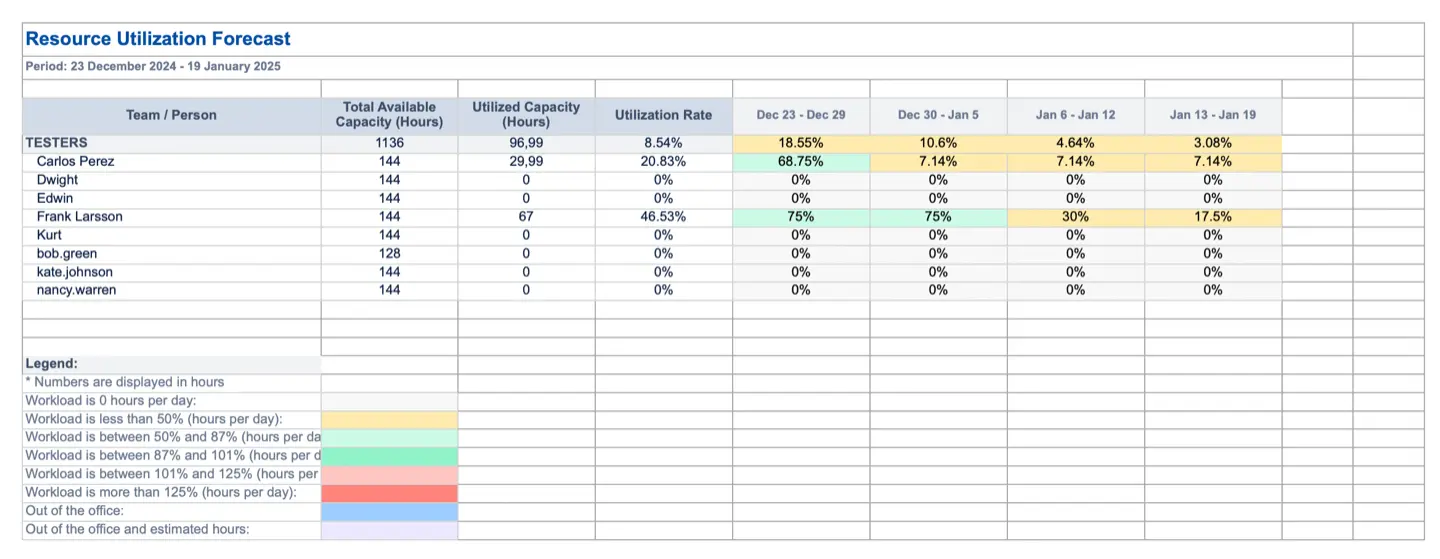
Sometimes you need to dig deeper, so you can export Jira data in Excel format to analyze trends or share with others. Use the option to create Excel report for more advanced reporting that pulls out key patterns, or for managing multiple projects. Exporting gives you a better look at project data and lets you track things like time spent and unresolved issues across projects.

Conclusion
Jira’s built-in reporting features are great, but why stop there? ActivityTimeline bridges the gap between reporting and resource planning, giving you the tools to optimize workflows, plan smarter, and keep your projects on track.