
Managing projects is difficult without a visual plan. Teams often struggle to see how tasks connect or when deadlines are close. A timeline Jira solves this by showing work over days, weeks, or months. Everyone can track progress and find problems on one dashboard.
To keep your projects organized, Jira Software has a built-in timeline tool. Anyone on a team who wants to work faster and stay on track should use this.
To see how it works, take a look at this YouTube guide on the Jira timeline.
{{tl-dr}}
What is a Jira timeline?
Jira timeline is a built-in visual planning tool that organizes epics, tasks, dependencies in a Gantt chart. Standard plans include a basic timeline view for single projects, Jira cloud premium offers Jira Plans for cross project planning. Beyond native features, various apps allow customizing Jira timelines to fit team needs. For example, ActivityTimeline.
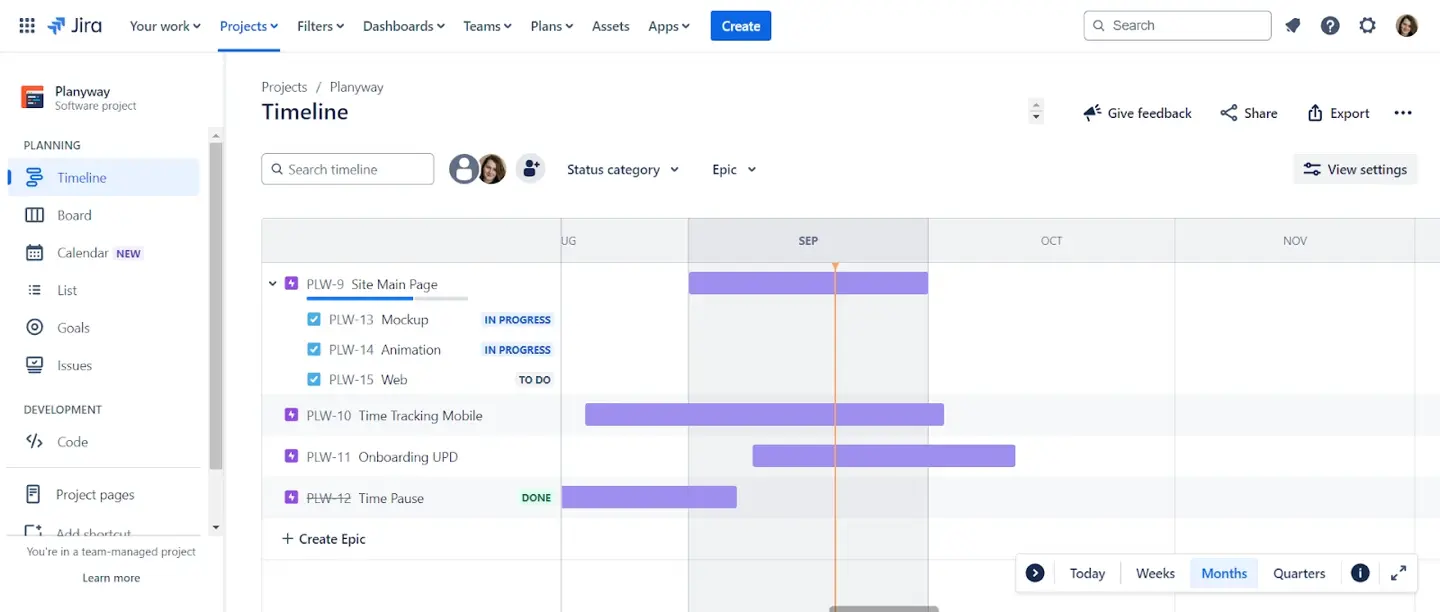
A project timeline provides a visual representation of work, laying out Jira issues as schedule bars based on their start/end dates. Schedule bars show how long tasks take and if they are finished. This helps managers see how project details fit into the schedule. The view also shows major milestones to know deadlines.
Using a timeline feature helps teams identify risks and avoid bottlenecks early. Leads can catch problems before they ruin the schedule because they see how tasks link together. Managers use this to assign work and see how several projects are doing right now.
Why your team needs a visual project timeline
Visual timelines help teams avoid planning errors and keep everyone on the same page.
Using timelines provides some benefits for your project management:
- Better Project Planning. Visual timelines show tasks on a calendar to see if a schedule is realistic or if too many tasks overlap.
- Stronger Collaboration. A shared timeline keeps everyone aligned. Stakeholders can even check the project's status at any time. Because of that you don't need to manually create status reports.
- Improved Productivity. When you have clear plans, you know exactly what to do next. Team members work faster and spend less time in meetings when they all know when their tasks are due.
- Smarter Resource Management. These views help managers distribute work evenly. Seeing each person's workload, leaders can prevent team burnout and allocate resources where they are needed most.
- Real-Time Progress Tracking. As work is being done, teams can monitor delivery. Also the plan can be changed at any time by managers if a task takes longer than planned.
- Identifying Risks. Mapping issue links reveals potential issues. Seeing how one task blocks another helps teams resolve problems early, preventing a delay from stopping the project.
Key features of the Jira timeline view
The Jira project timeline has several features to help you manage work easily.
- Drag-and-Drop feature. Drag bars on the calendar to change the start and end dates. This is much faster than opening every ticket to edit dates manually.
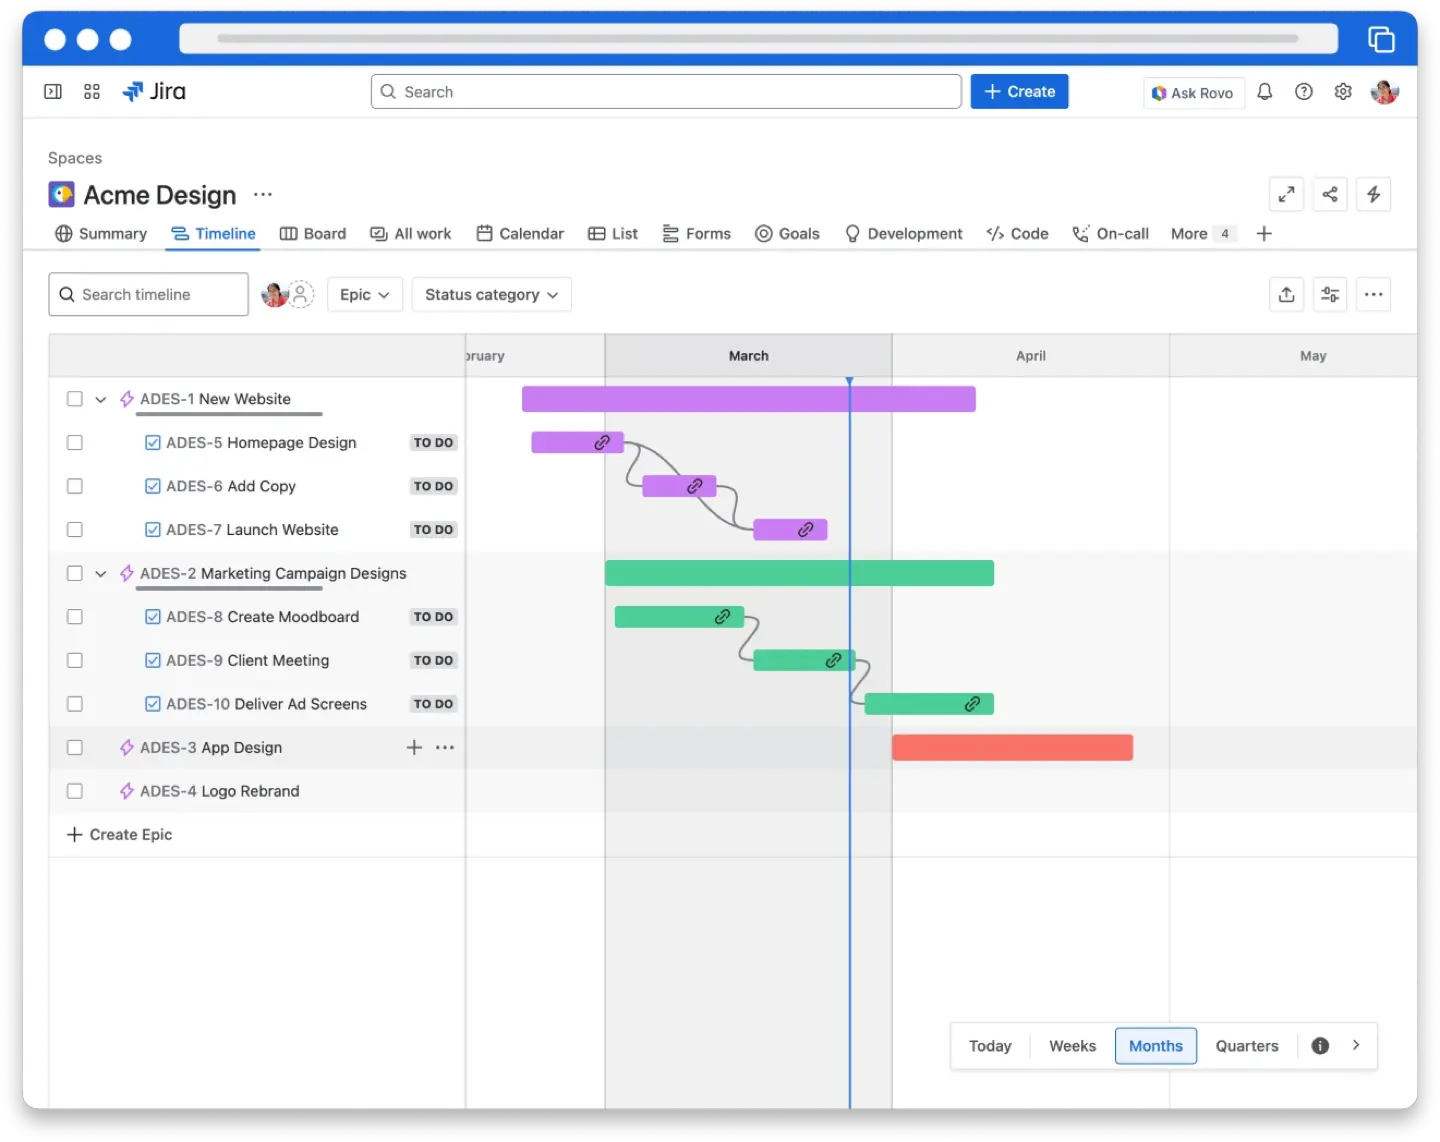
- Dependency Mapping. The view shows icons between tasks to show if one blocks another. If a deadline conflict happens, these icons turn red to warn you.
- Hierarchy and Progress. View Epics and child issues in one view. Progress bars show completion status. Track work by the number of completed issues or story point estimates.
- Custom Filtering. You can filter the view by person, status, or team. You can also switch between viewing your plan by week, month, or quarter.
- Release Health. Round icons show if your project version is on schedule. A green icon means everything is fine. A red icon shows a delay that needs attention.
Limitations of native Jira timelines
Jira's basic timeline is helpful, but it also has some limitations:
- Visibility Constraints. The timeline usually hides issues completed more than 30 days ago. Besides, custom hierarchies and sub-tasks are often not visible in the standard view.
- Resource Management Gaps. Native timelines lack real-time workload indicators. It's difficult to see if a person is available or overbooked across different projects.
- Scheduling and Estimation. Kanban schedules are locked at one week and cannot be changed. You cannot swap between story points and hours without losing unsaved data. Task rankings on the timeline also do not appear in regular Jira views.
- Cross-Project Visibility. Seeing multiple teams and projects in one place is difficult without upgrading to Jira Premium. Even then, cross-project releases are strictly for planning and cannot always be saved back to standard Jira views.
The Atlassian Marketplace offers many apps to fill these gaps. For example, ActivityTimeline is a great option to cover gaps in Jira timelines.
Creating a Jira timeline with ActivityTimeline
ActivityTimeline is a tool for planning team work and managing resources. It is designed to help organizations better plan and manage teamwork, schedule events, vacations, bookings, track workload, and generate timesheets and other reports
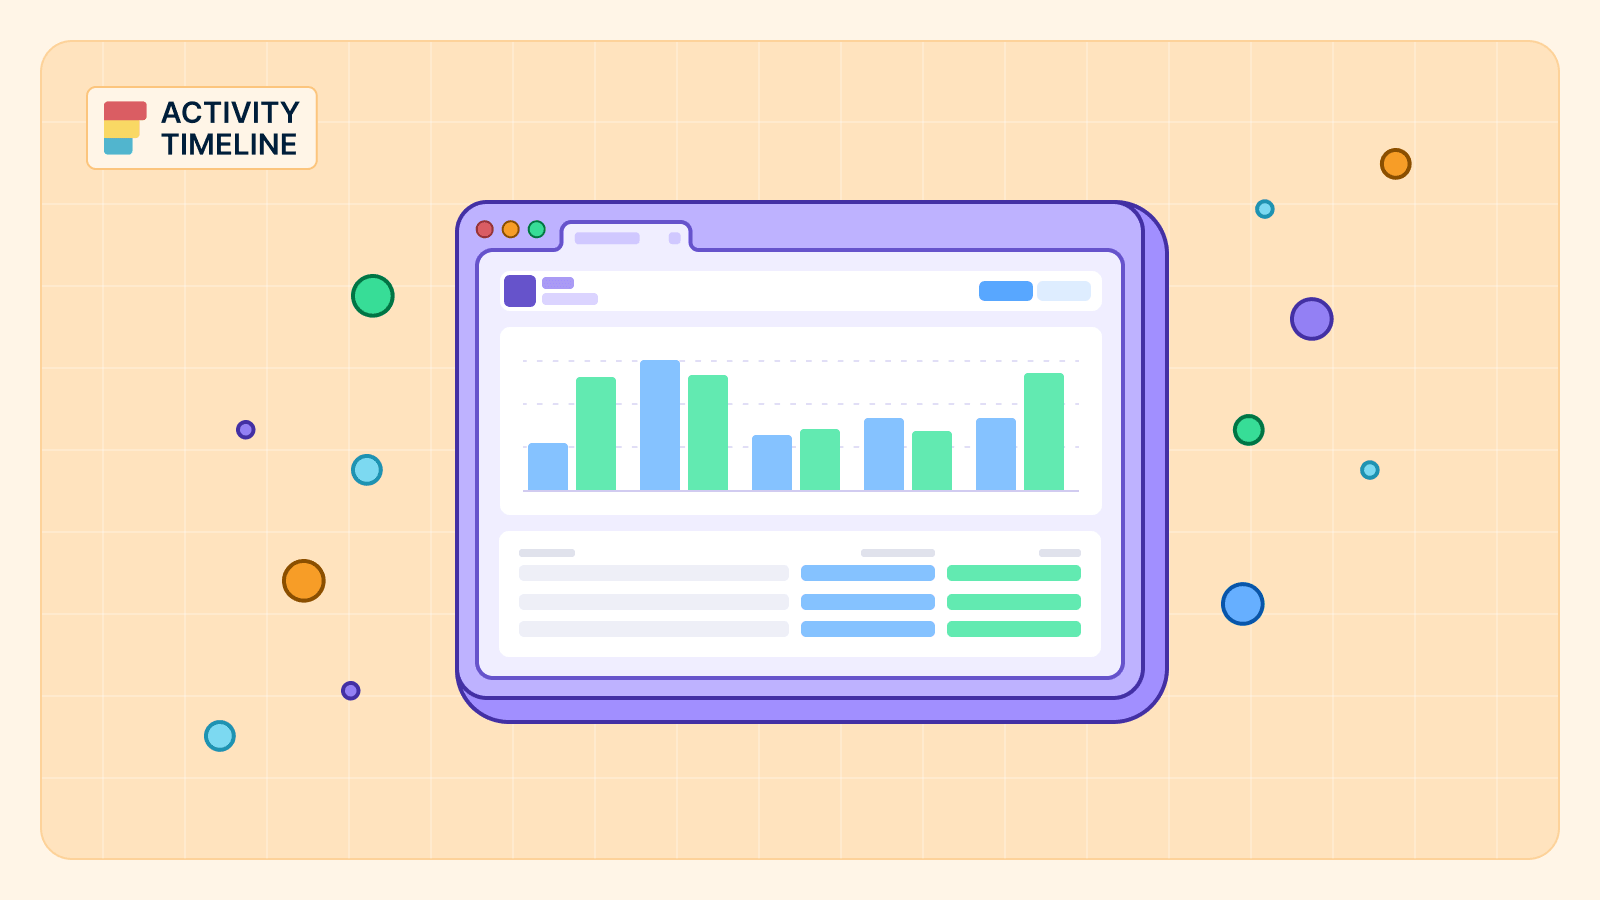
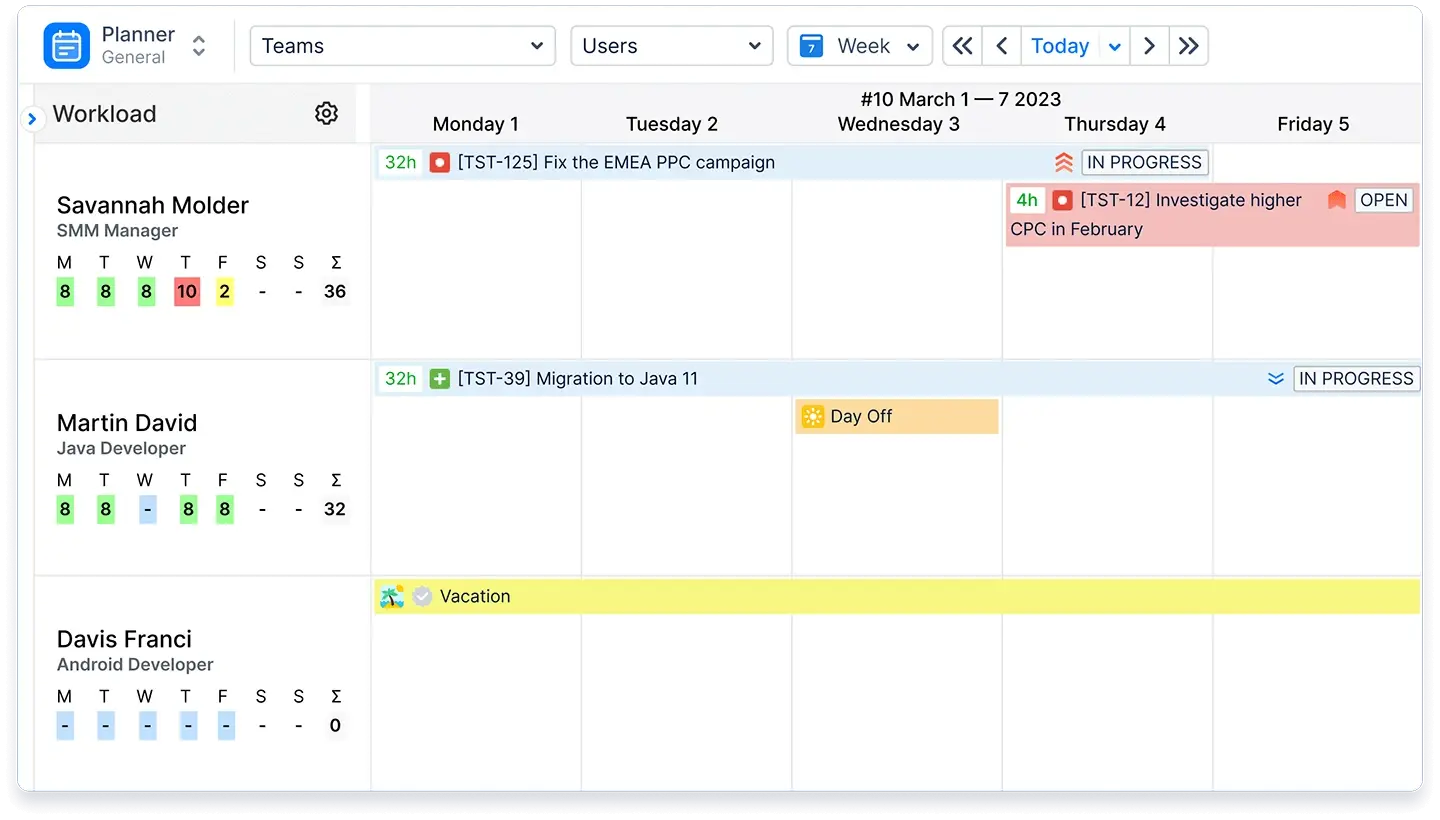
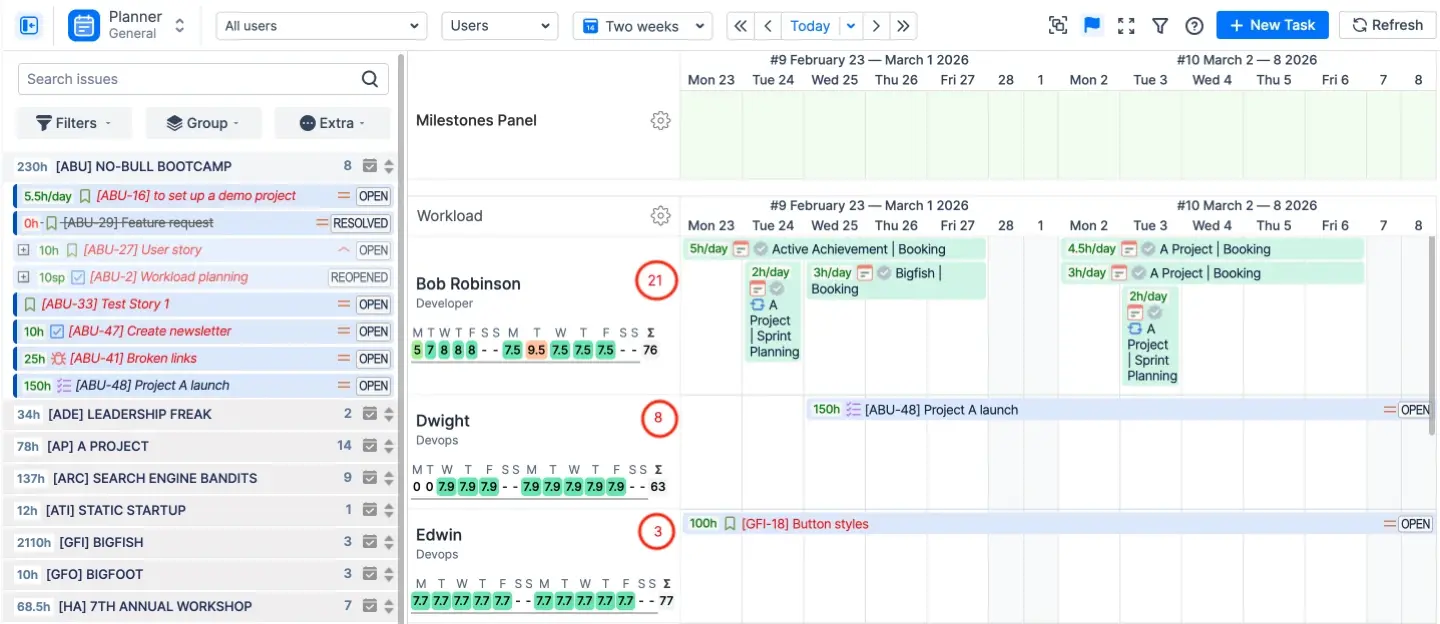
The Resource Planning Dashboard (Planner) is the central command center of the app to show Jira projects and schedules in one place. There is a good feature (Workload Indicator) that shows if a person is over-/underloaded.
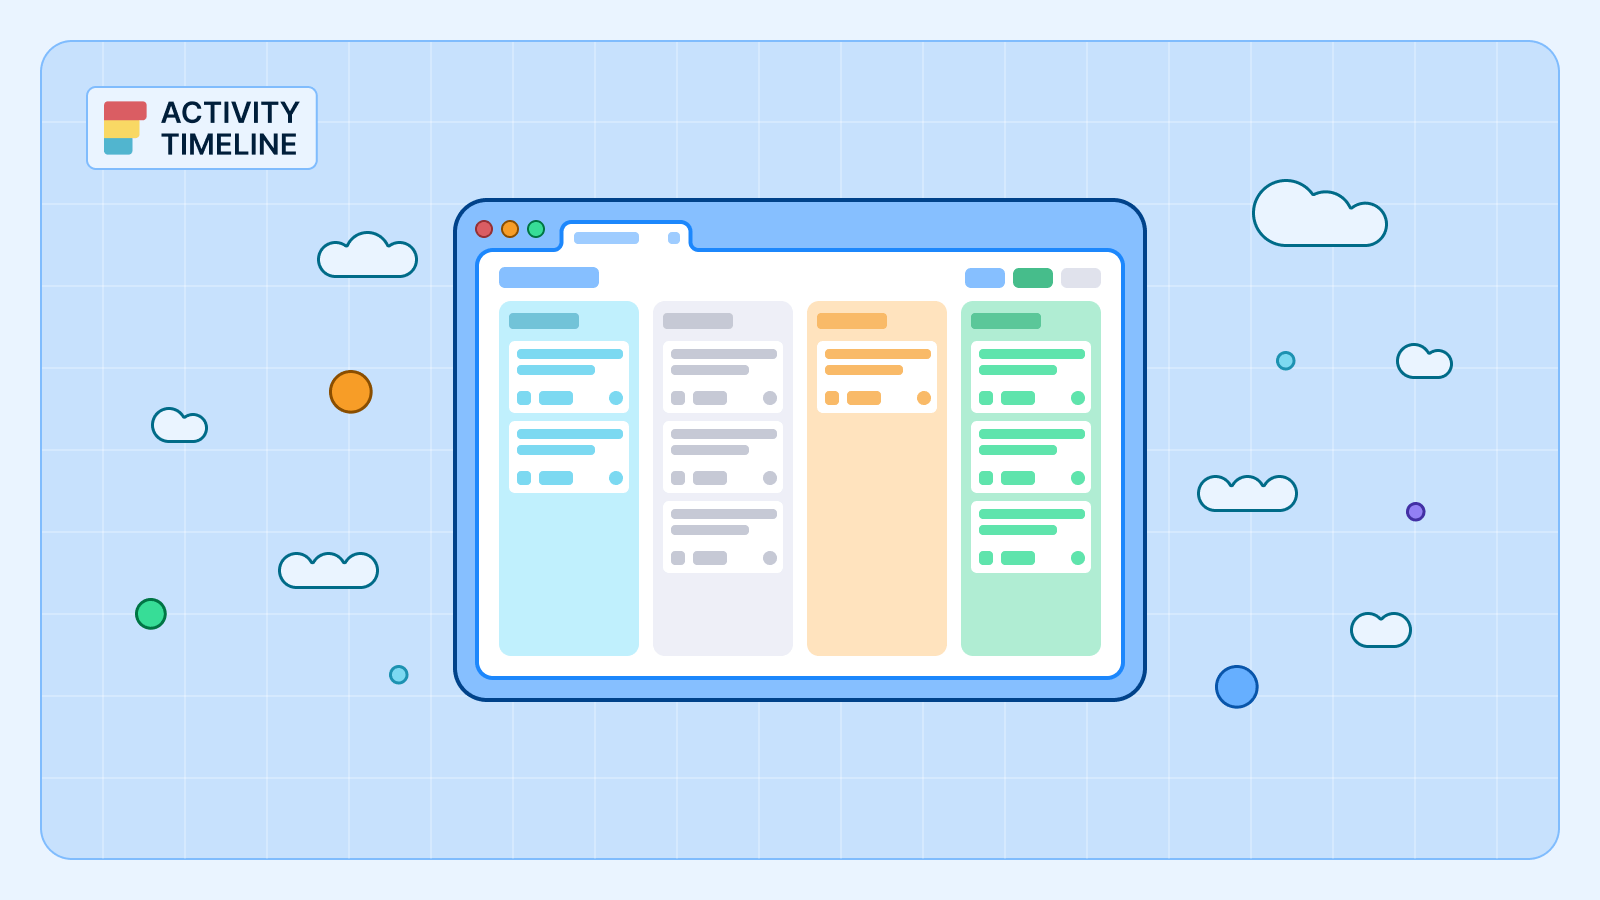
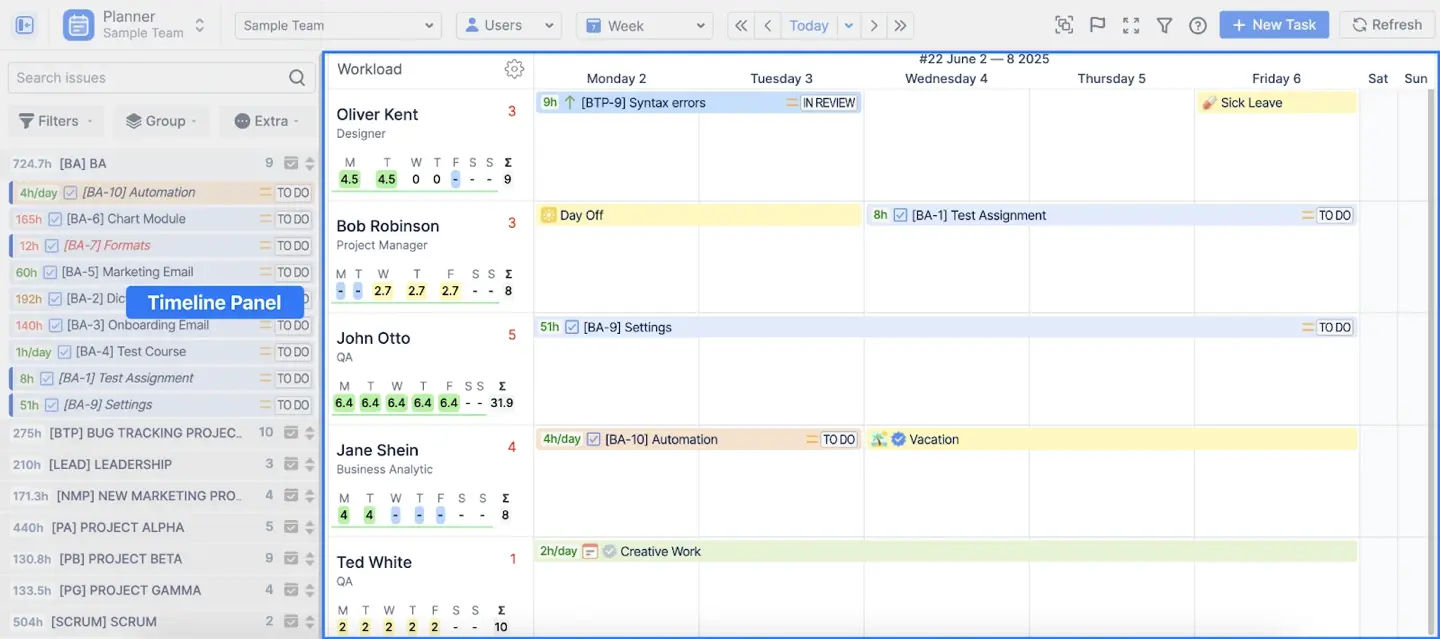
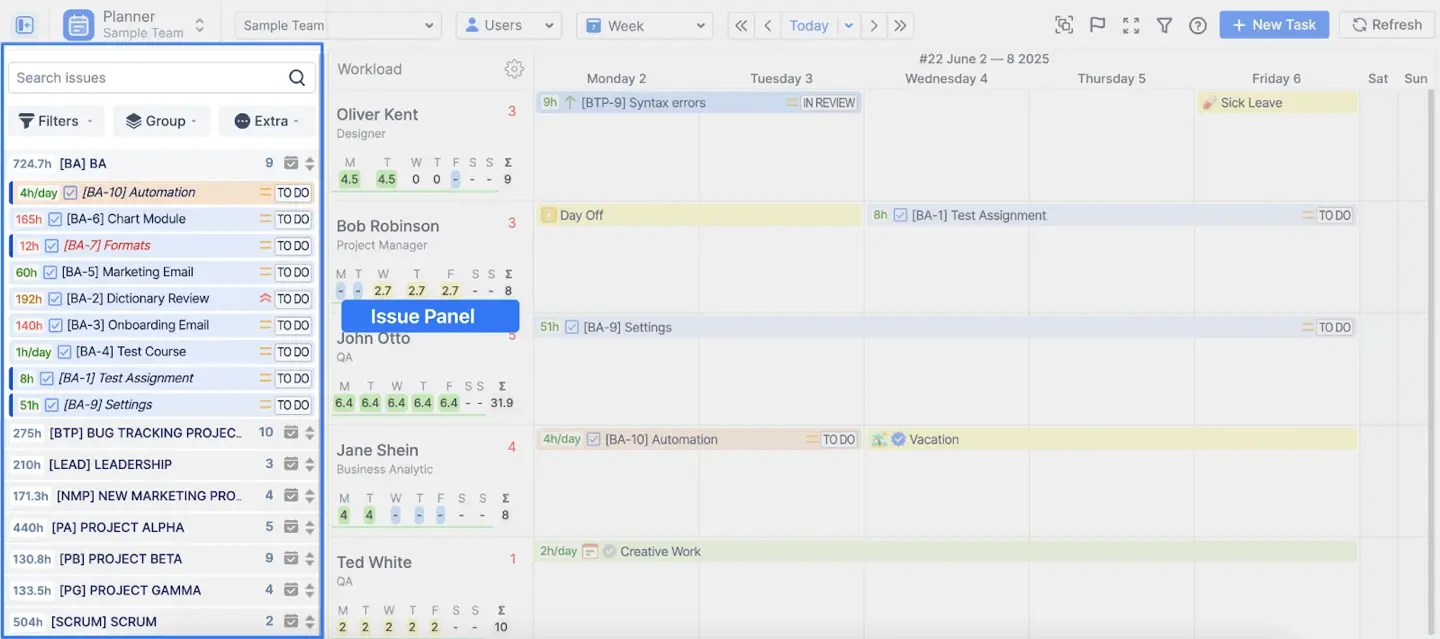
The main screen is split into two parts. The Issues Panel on the left holds the task backlog. The Timeline Panel on the right is a calendar for scheduling.
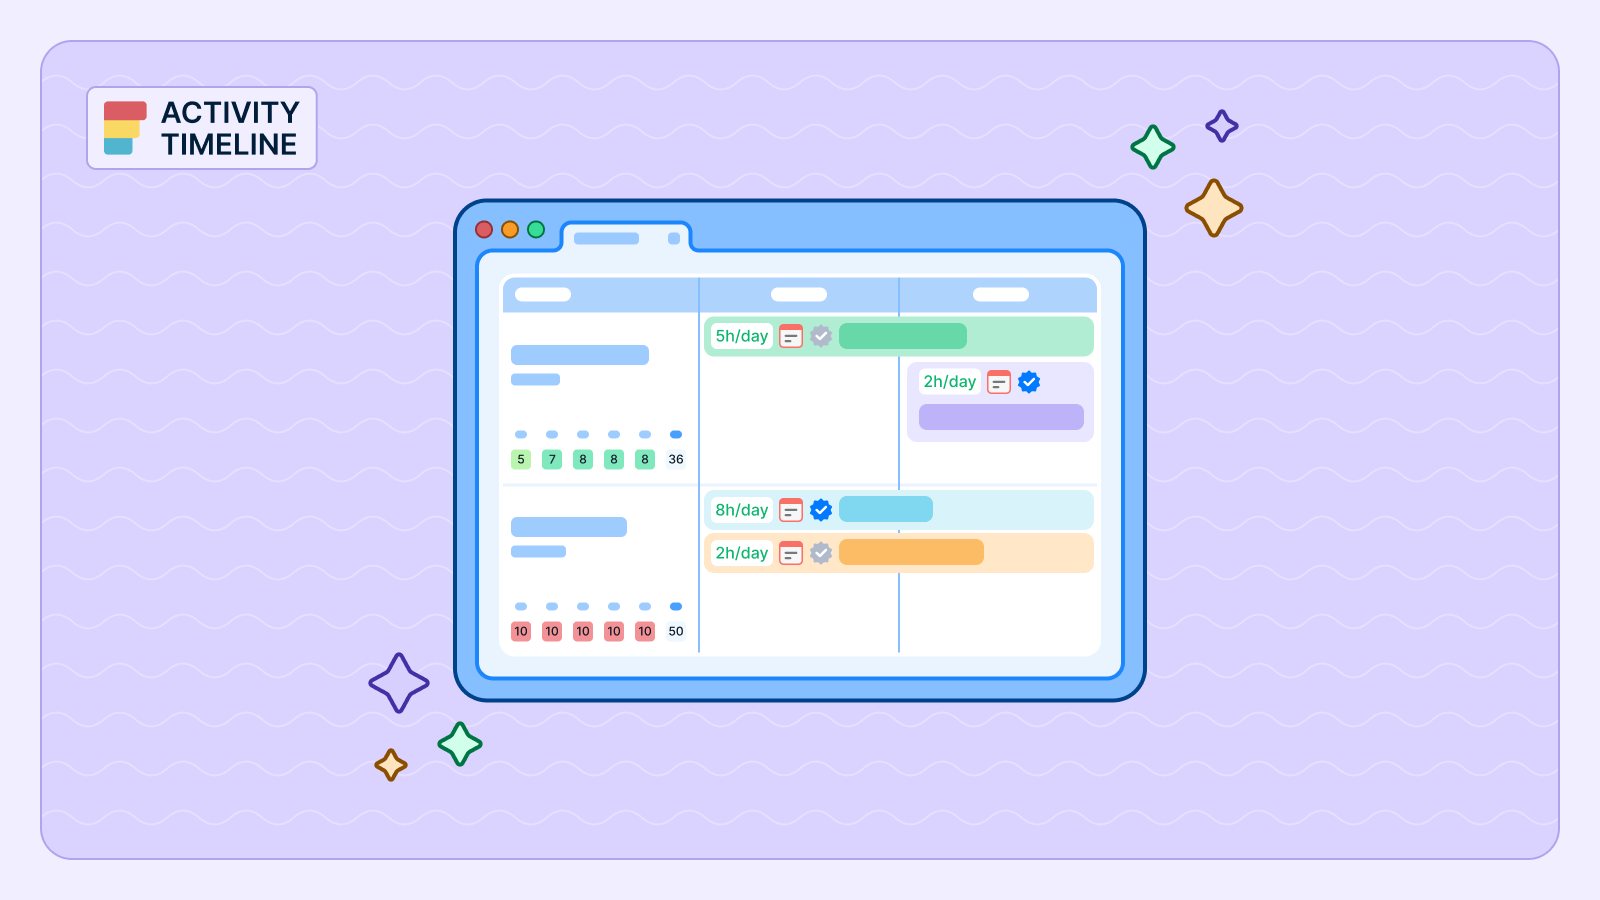
The timeline panel uses rows for people and columns for time units. You can switch between different views or see both at once. The Users view is for individual tasks. The Teams view helps with Epics. The timeframe is flexible. For long-term planning, zoom in to view days and weeks or zoom out for months, quarters, or years.
The drag-and- drop tool lets you instantly schedule tasks without creating individual Jira tickets. Just take a ticket from the backlog and move it onto the user's timeline. This automatically updates the Jira dates and the assignee.
Hold the Shift key to divide a job between several days or people if it is too big. With the Ctrl key you can create a placeholder. This lets you test a plan without changing the original Jira ticket until you are ready.
Best practices for effective project planning
Effective planning goes beyond making a to do list. When teams follow these steps, they can stay on schedule and avoid making common mistakes.
Start with a Clear Project Scope
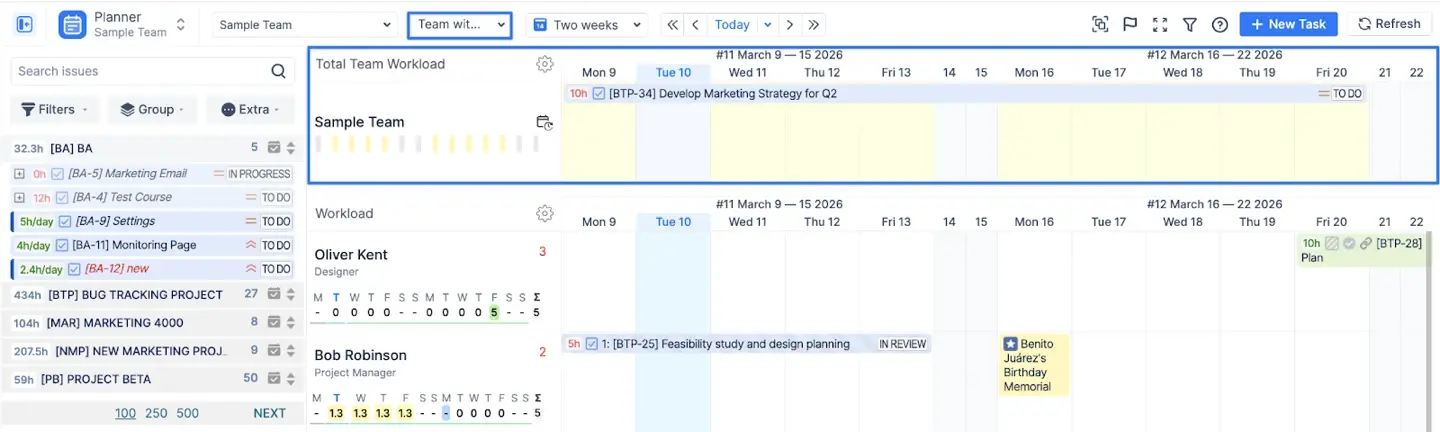
Defining goals early improves planning accuracy. In ActivityTimeline, you can use the Team Panel to plan at a strategic level. Instead of micromanaging, you can schedule large projects like Epics for a whole department. You can also use placeholders to test different scenarios months in advance without changing your Jira backlog.
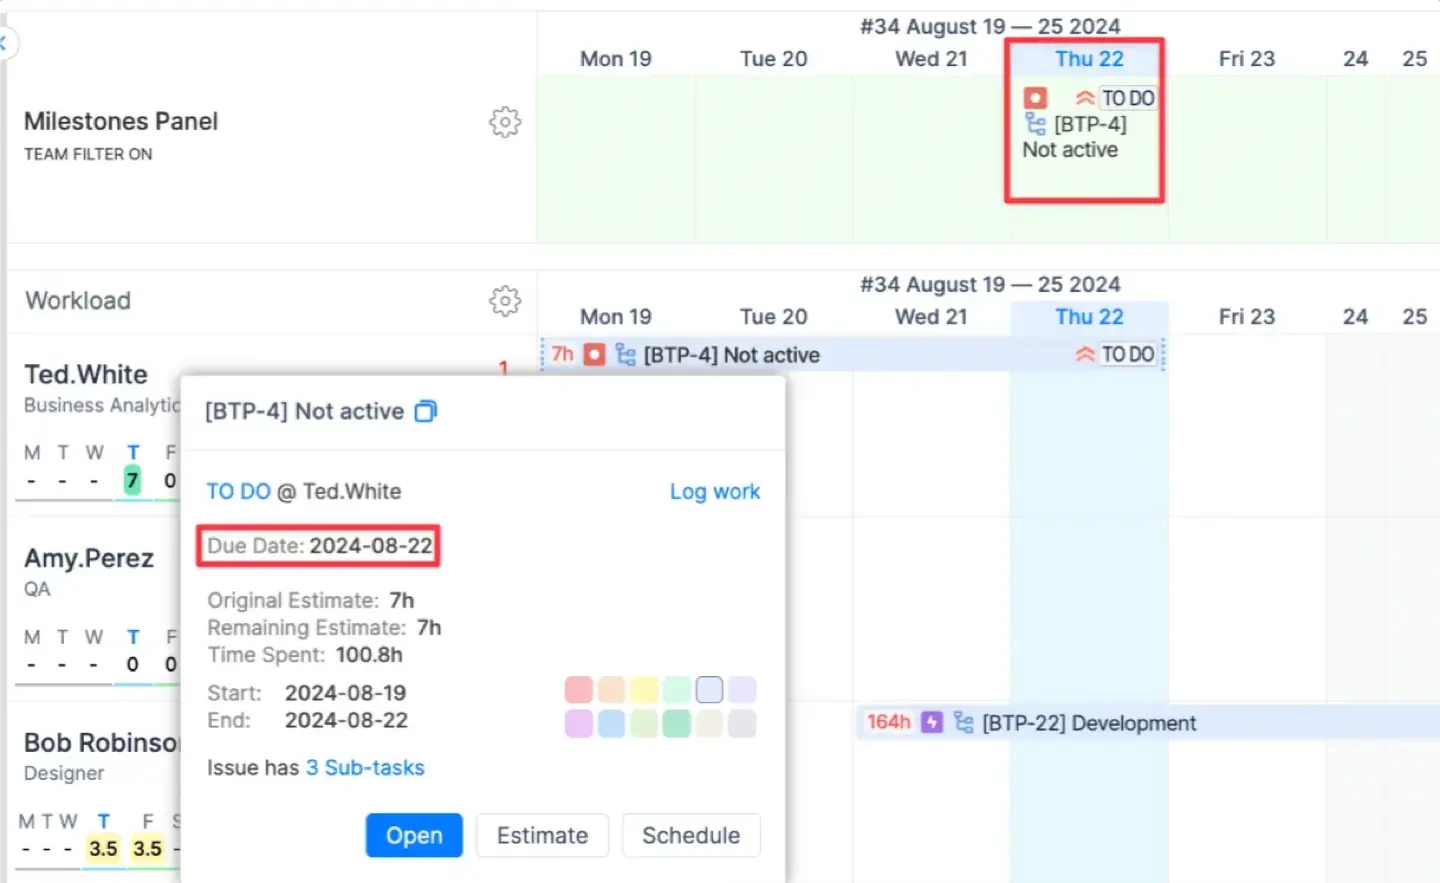
Define Milestones Early
Milestone tracking keeps everyone aligned on deadlines and releases. ActivityTimeline features a dedicated Milestones Panel above the user timelines. You can add markers for demos or project deadlines so the team knows exactly when work is due. These markers can automatically sync and display Jira Fix Versions and Sprint dates.
Equalize the team's work
Distributing chores guarantees that no one team member bears too much responsibility while others are underused. Visibility into these workloads prevents burnout. ActivityTimeline uses color-coded indicators to show true capacity. These bars account for tasks, vacations, and sick leave.
Always monitor progress
When there are delays, having regular updates helps you deal with them quickly. ActivityTimeline shows a red warning number next to a user's name if they have overdue tasks. You can also use the Bulk Reschedule tool to move all related tasks forward if a project timeline shifts.
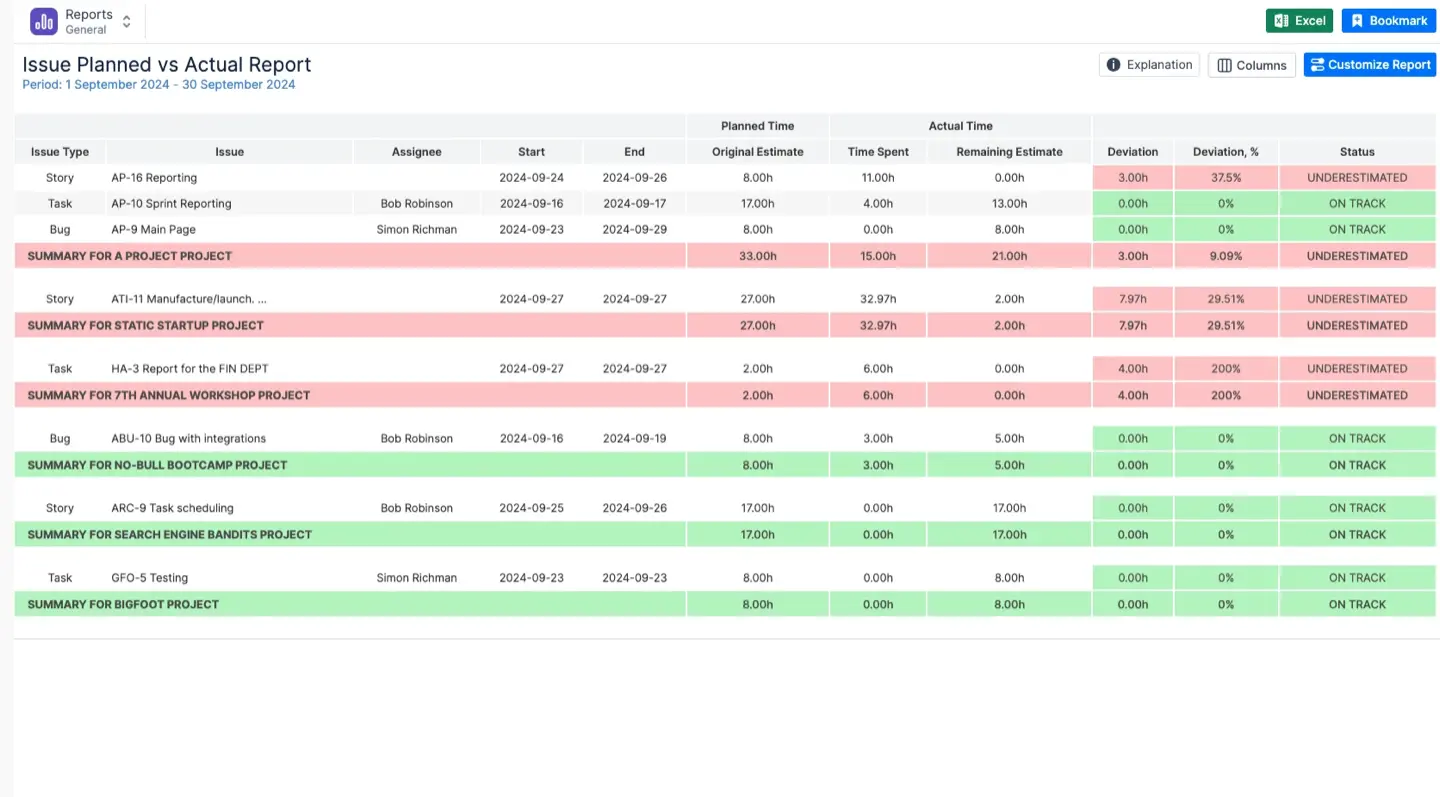
Use Reports for Insights
Tracking time spent on tasks improves future decisions. Reports can help you with that. Original estimations are compared in the Planned vs. Actual Report to the time actually logged. This helps you improve future estimations based on actual data and exposes whether work was undervalued.
Monitoring time and resources with ActivityTimeline
ActivityTimeline provides tools to monitor how much your team spends on Jira projects. This data clarifies for managers whether resources should be relocated or if projects are on schedule.
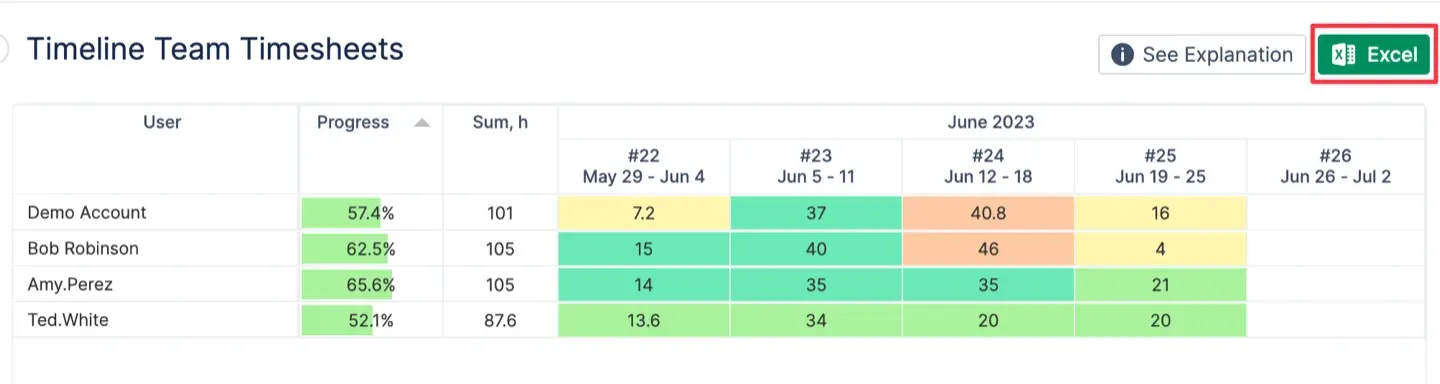
The Timeline Timesheet view displays a calendar together with a list of people. It uses color codes to show if someone logged too much or too little time compared to their daily requirements. You can click on a specific day to see exactly which tasks a person worked on. This visual approach makes it easy to spot work patterns across the whole team.
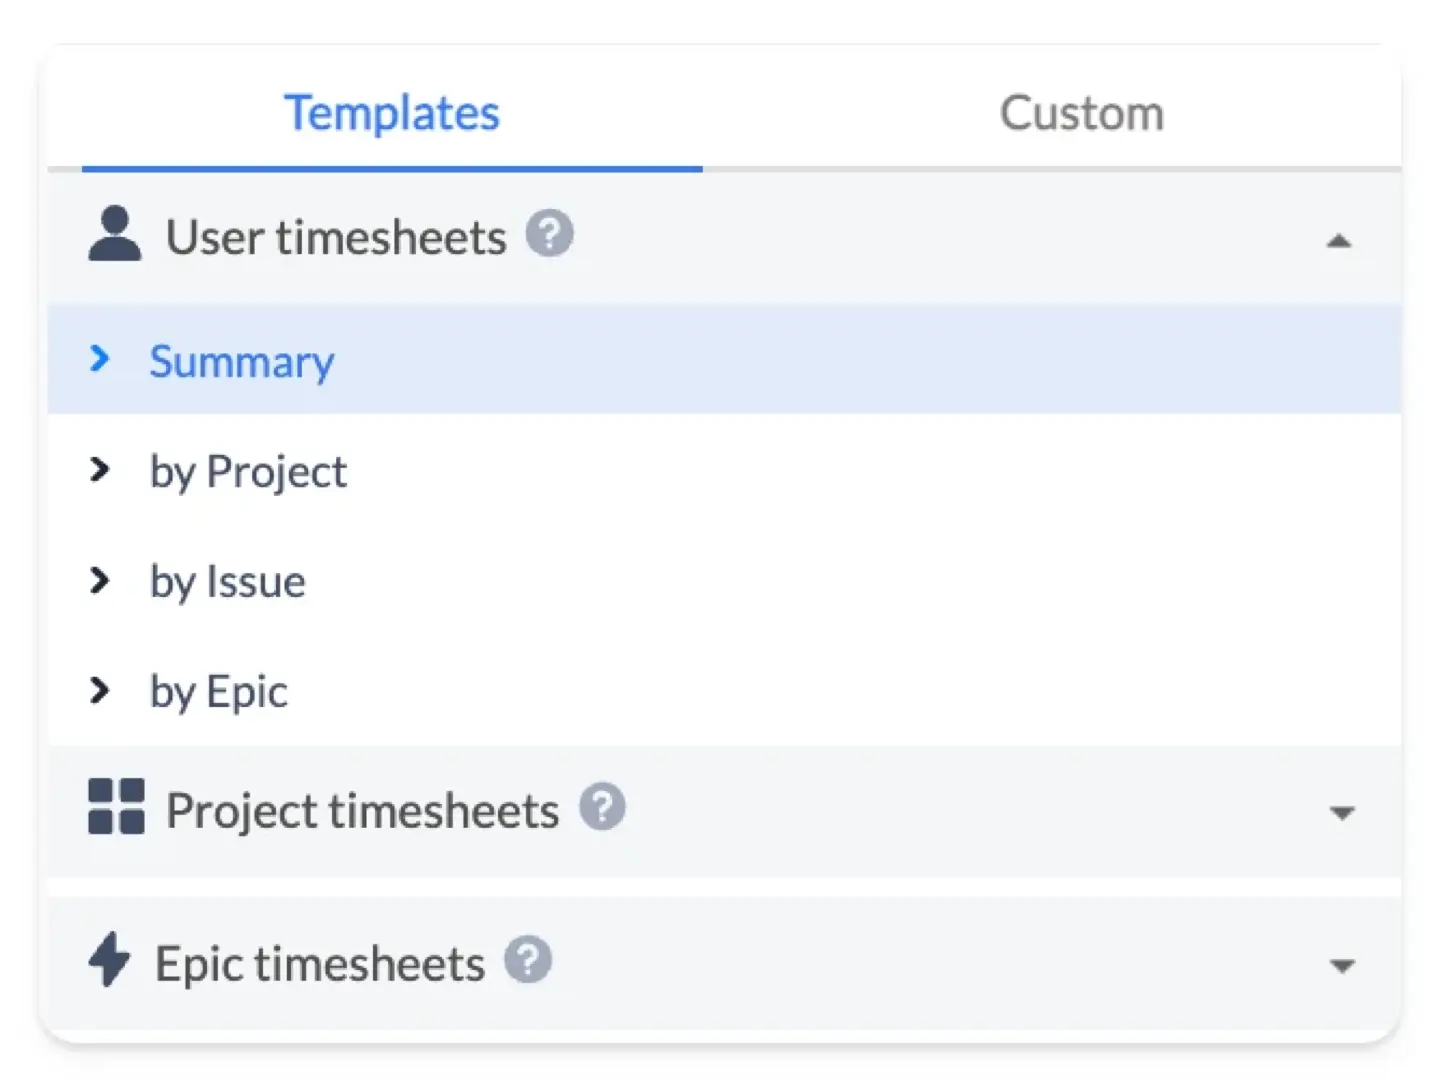
To speed up reporting, the app includes several timesheet templates. You can view data by:
- User: See a summary of hours for each team member.
- Issue or Epic: Track how much effort goes into specific tasks or large project goals.
- Project: View total time spent on a single project with a breakdown of who did the work.
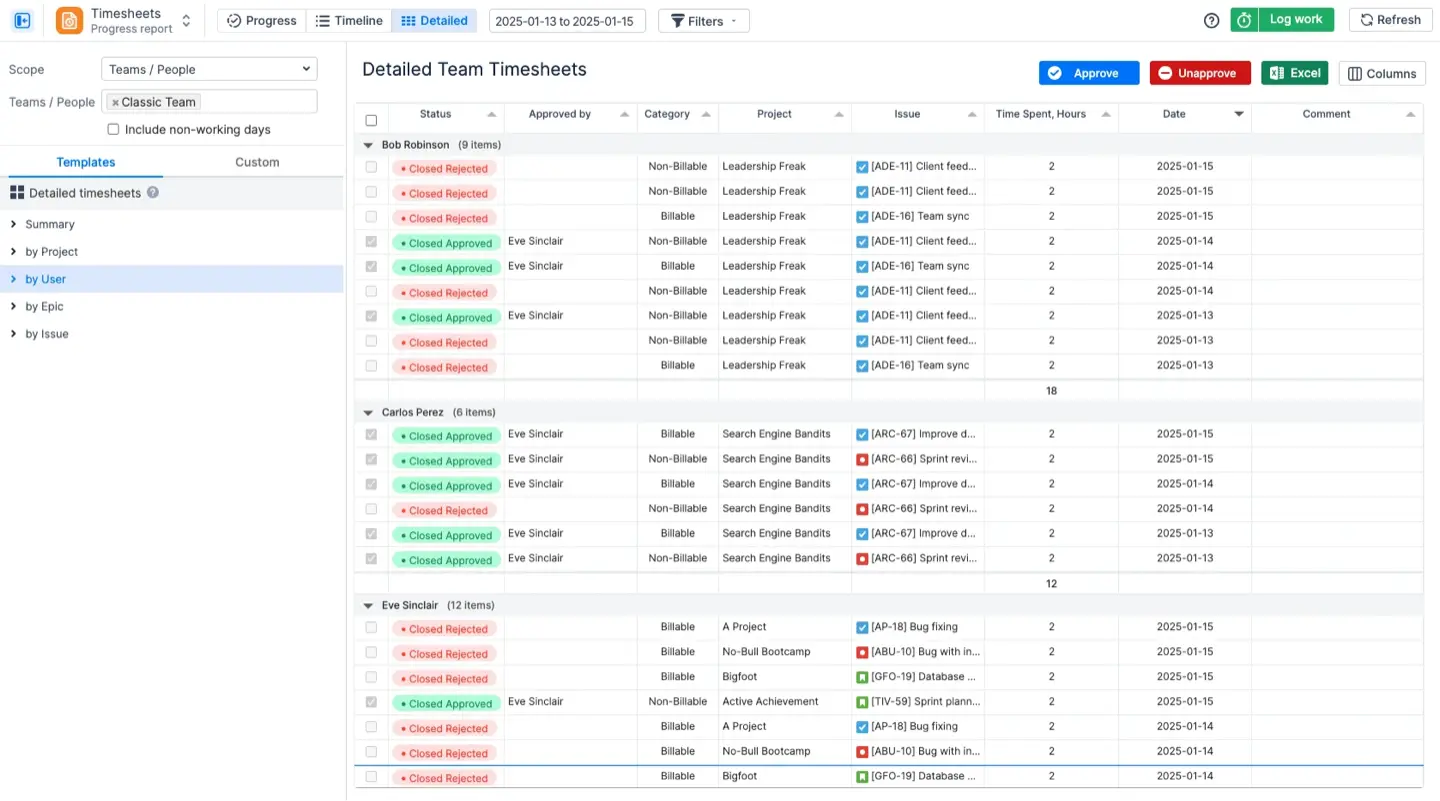
The Detailed Timesheet view provides a line-by-line list of every work entry. Managers use this to review user comments, work logs and approve timesheets. To find which categories take the most time, you could arrange this data using Jira Custom Fields.
All reports and timesheets can be saved to Excel with one click. The exported file keeps the same structure and grouping as the web version. For financial analysis, payroll processing, or client invoicing generation, this is useful. Employees can export their own individual logs but managers can export data for whole teams.
ELVA replaced manual planning with a clear weekly view for every employee. Their managers now extend tasks over several days on the timeline to manage workloads better. This real-time visibility helped the company stay organized as it grew. It made daily scheduling simpler and ensured all project data remained accurate for their team leads
Conclusion
It is best to use a Jira timeline view to keep your projects clear and organized. It lets teams visualize real-time progress, control dependencies, and see deadlines. The native timeline Jira features offer a strong start, but they lack deep resource management insights.
Apps like ActivityTimeline fill these gaps by providing clear workload indicators and detailed timesheets. By combining visual planning with smart resource allocation, you can prevent burnout andCombining clever resource allocation with visual planning helps you avoid burnout and guarantees that projects stay on schedule.
{{rich-cta-1}}