A solid project management report isn't just a formality—it’s the backbone of clear communication, better decision-making, and keeping your project on track. Whether it’s a project status report, a project progress report, or a deep dive into project risks, the right report helps key stakeholders stay on the same page.
The challenge? Many Jira reports end up being long, cluttered, and difficult to act on. That’s where structured, data-driven reporting makes all the difference. And if you’re using the right project management tool—like ActivityTimeline—you can simplify the entire reporting process with automated insights, visual charts, and real-time project data.
1. Define the Purpose of Your Report
Not every project report serves the same function. Before you create a project management report, ask yourself: Who is reading this? What do they need to know?
- Project managers might need a project progress report to assess whether tasks are on track.
- Stakeholders may prefer a high-level project status report to understand overall project health.
- Teams might want a more detailed breakdown of milestones, project delays, and resource allocation.
Start with the end in mind. Focus on key data points that align with your project’s goals. The clearer the purpose, the more effective the report.
2. Use a Consistent Report Structure
A messy report leads to messy decision-making. Keep your project management reports structured so stakeholders can easily find the information they need.
A strong project report typically includes:
- Summary: A quick snapshot of the project’s current status.
- Key Metrics: Project milestones, budget report, resource utilization.
- Risks & Roadblocks: Project risks that could impact the timeline.
- Next Steps: Actionable steps to move the project ahead.
Consistency makes it easier to compare previous reports and spot trends. Plus, using a project status report template ensures your reports stay readable and actionable.
3. Highlight Project Progress
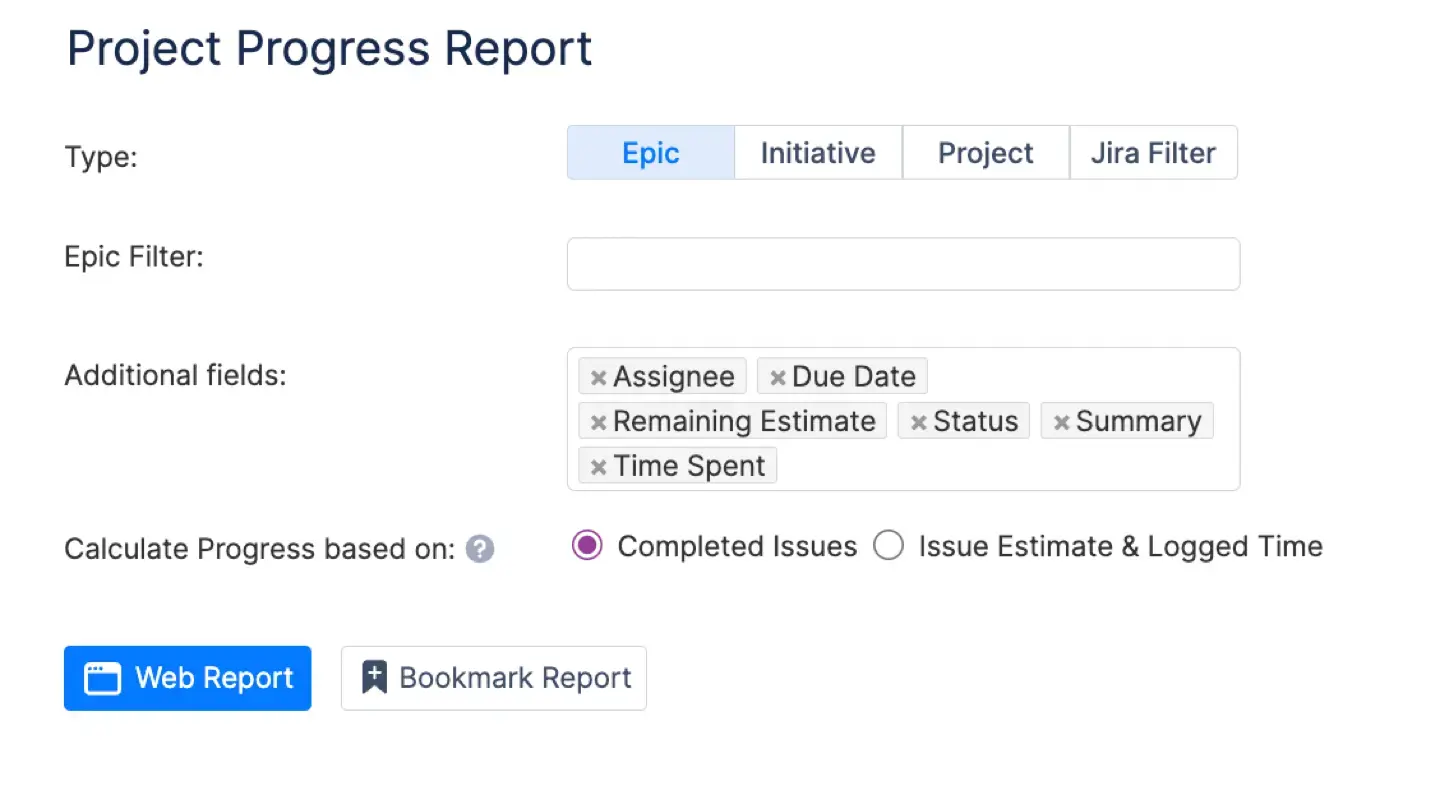
Keeping track of a project's progress is like checking your GPS while driving—you need to know if you're on the right path. That’s where ActivityTimeline’s Project Progress Report steps in. It helps project managers and teams visualize progress by breaking down work at every level—whether by Jira project, epic, initiative, or even a custom Jira filter:

With this report, you can:
- Track the percentage of completed vs. pending tasks across projects.
- Customize what fields are displayed for a clear snapshot of your project’s status.
- View the full issue hierarchy, from sub-tasks to epics, ensuring nothing falls through the cracks.
- Hide completed issues for a cleaner view while still factoring them into calculations.
The report calculates progress using Jira’s Time Tracking field or the number of tasks completed. It aggregates the time spent and remaining across all sub-tasks and parent tasks, giving you an accurate picture of where your project stands.
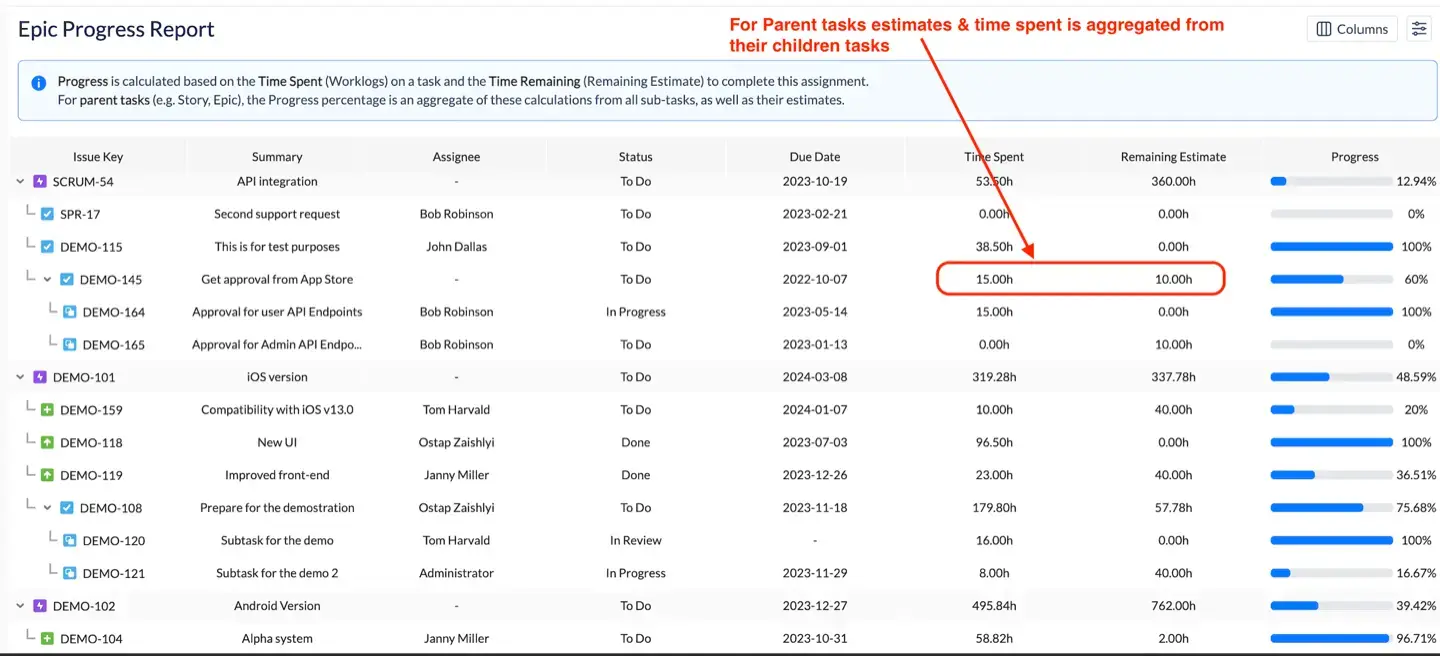
Let’s say an epic has 40 hours estimated, but only 5 hours have been logged so far, with 10 hours remaining on a child story and 20 hours already spent on a sub-task. The system rolls up all this data, giving you a real-time view of actual progress compared to initial estimates. This level of insight helps teams stay aligned and adjust as needed.
4. Compare Planned vs. Actual Progress
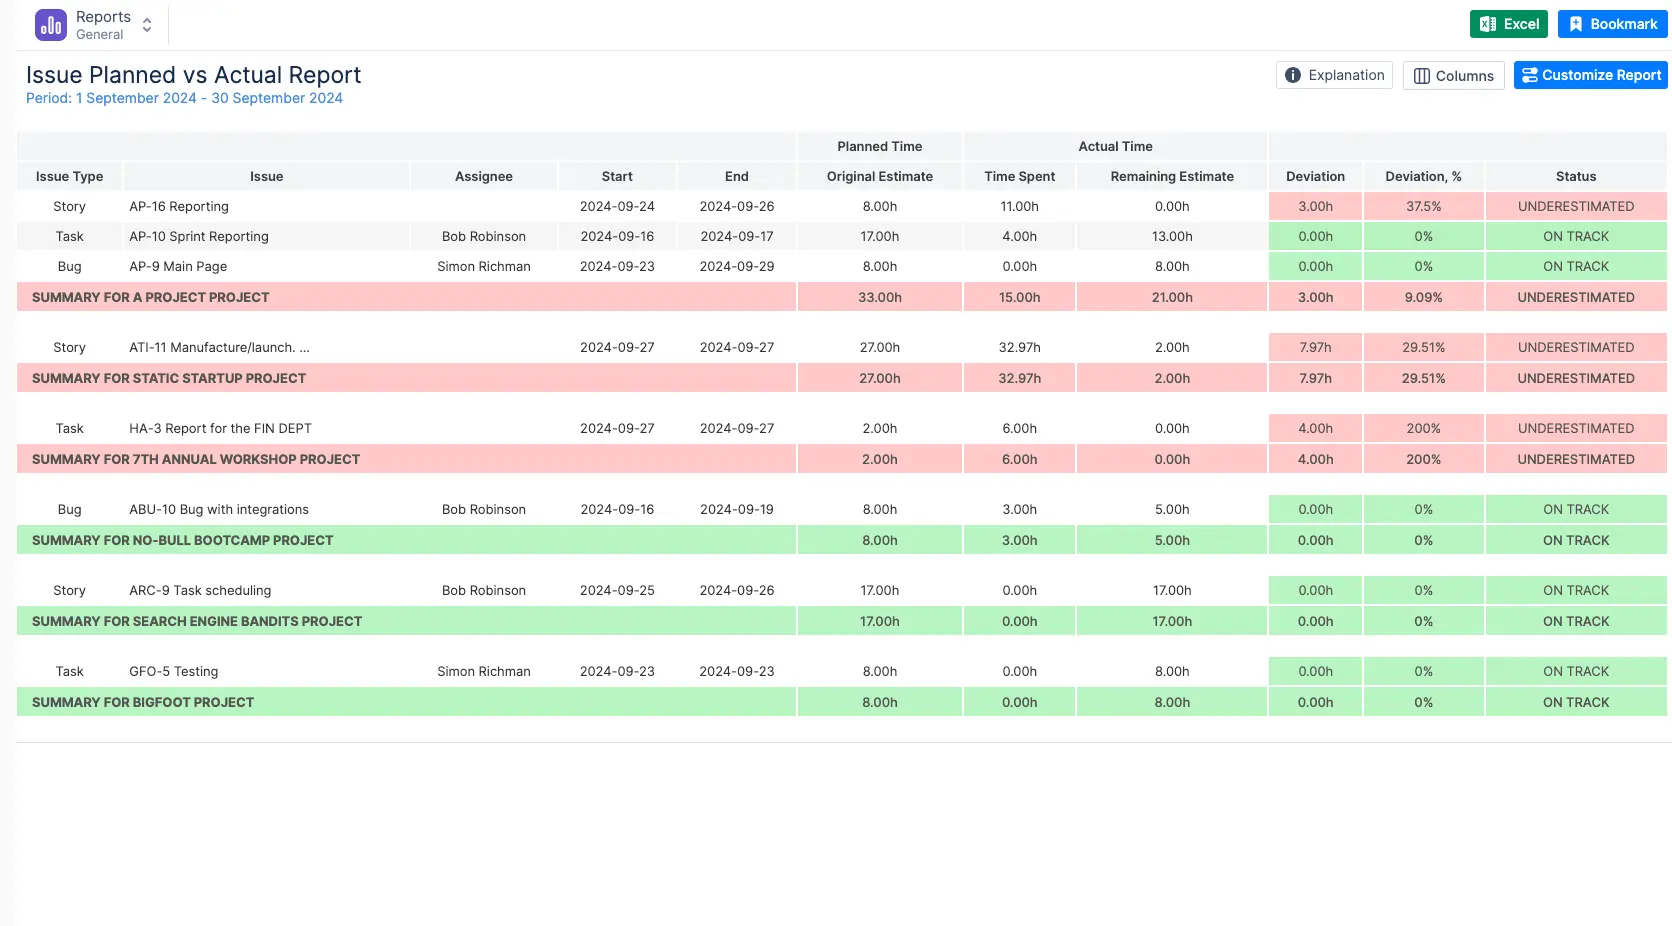
Planning is great, but reality often has other plans. The Planned vs. Actual Report in ActivityTimeline helps project managers assess whether their initial estimates were spot-on or way off.
Here’s what this report delivers:
- Planned Time vs. Actual Time – It compares the original estimates with the time actually spent on tasks, helping teams see where they under or overestimated work.
- Deviation Analysis – The report highlights the difference between estimated and actual time in both hours and percentages.
- Status Indicators – Tasks are marked with:
- On Track (Green) – Actual time matches original estimates.
- Overestimated (Yellow) – Less time was needed than planned.
- Underestimated (Red) – More time was needed than expected.
- Multiple Levels of Detail – Whether you’re tracking individual issues, full projects, or large epics, the report aggregates data to match your needs.
- Customizable Filters – Narrow results by team, time period, project, or Jira filters for precise insights.
Need to refine future estimates? This report helps you spot patterns, making sure your team’s planning process improves over time. Whether you're tracking resource allocation or project delays, having real-time comparisons at your fingertips means you can make better decisions faster.
With reports like these, your project management workflow becomes data-driven, proactive, and—most importantly—effective.
5. Utilize Charts and Visual Data
Numbers are great, but visuals tell the real story. ActivityTimeline’s charts give you instant insights, helping you make quick, data-backed decisions. No more drowning in spreadsheets—just clean, clear visuals that show what’s working and what’s not.
Ever feel like your project plans and reality are speaking different languages? The Planned vs. Actual Chart bridges that gap. It lets project managers compare estimated work vs. real execution over a specific period, so you know exactly where things stand.
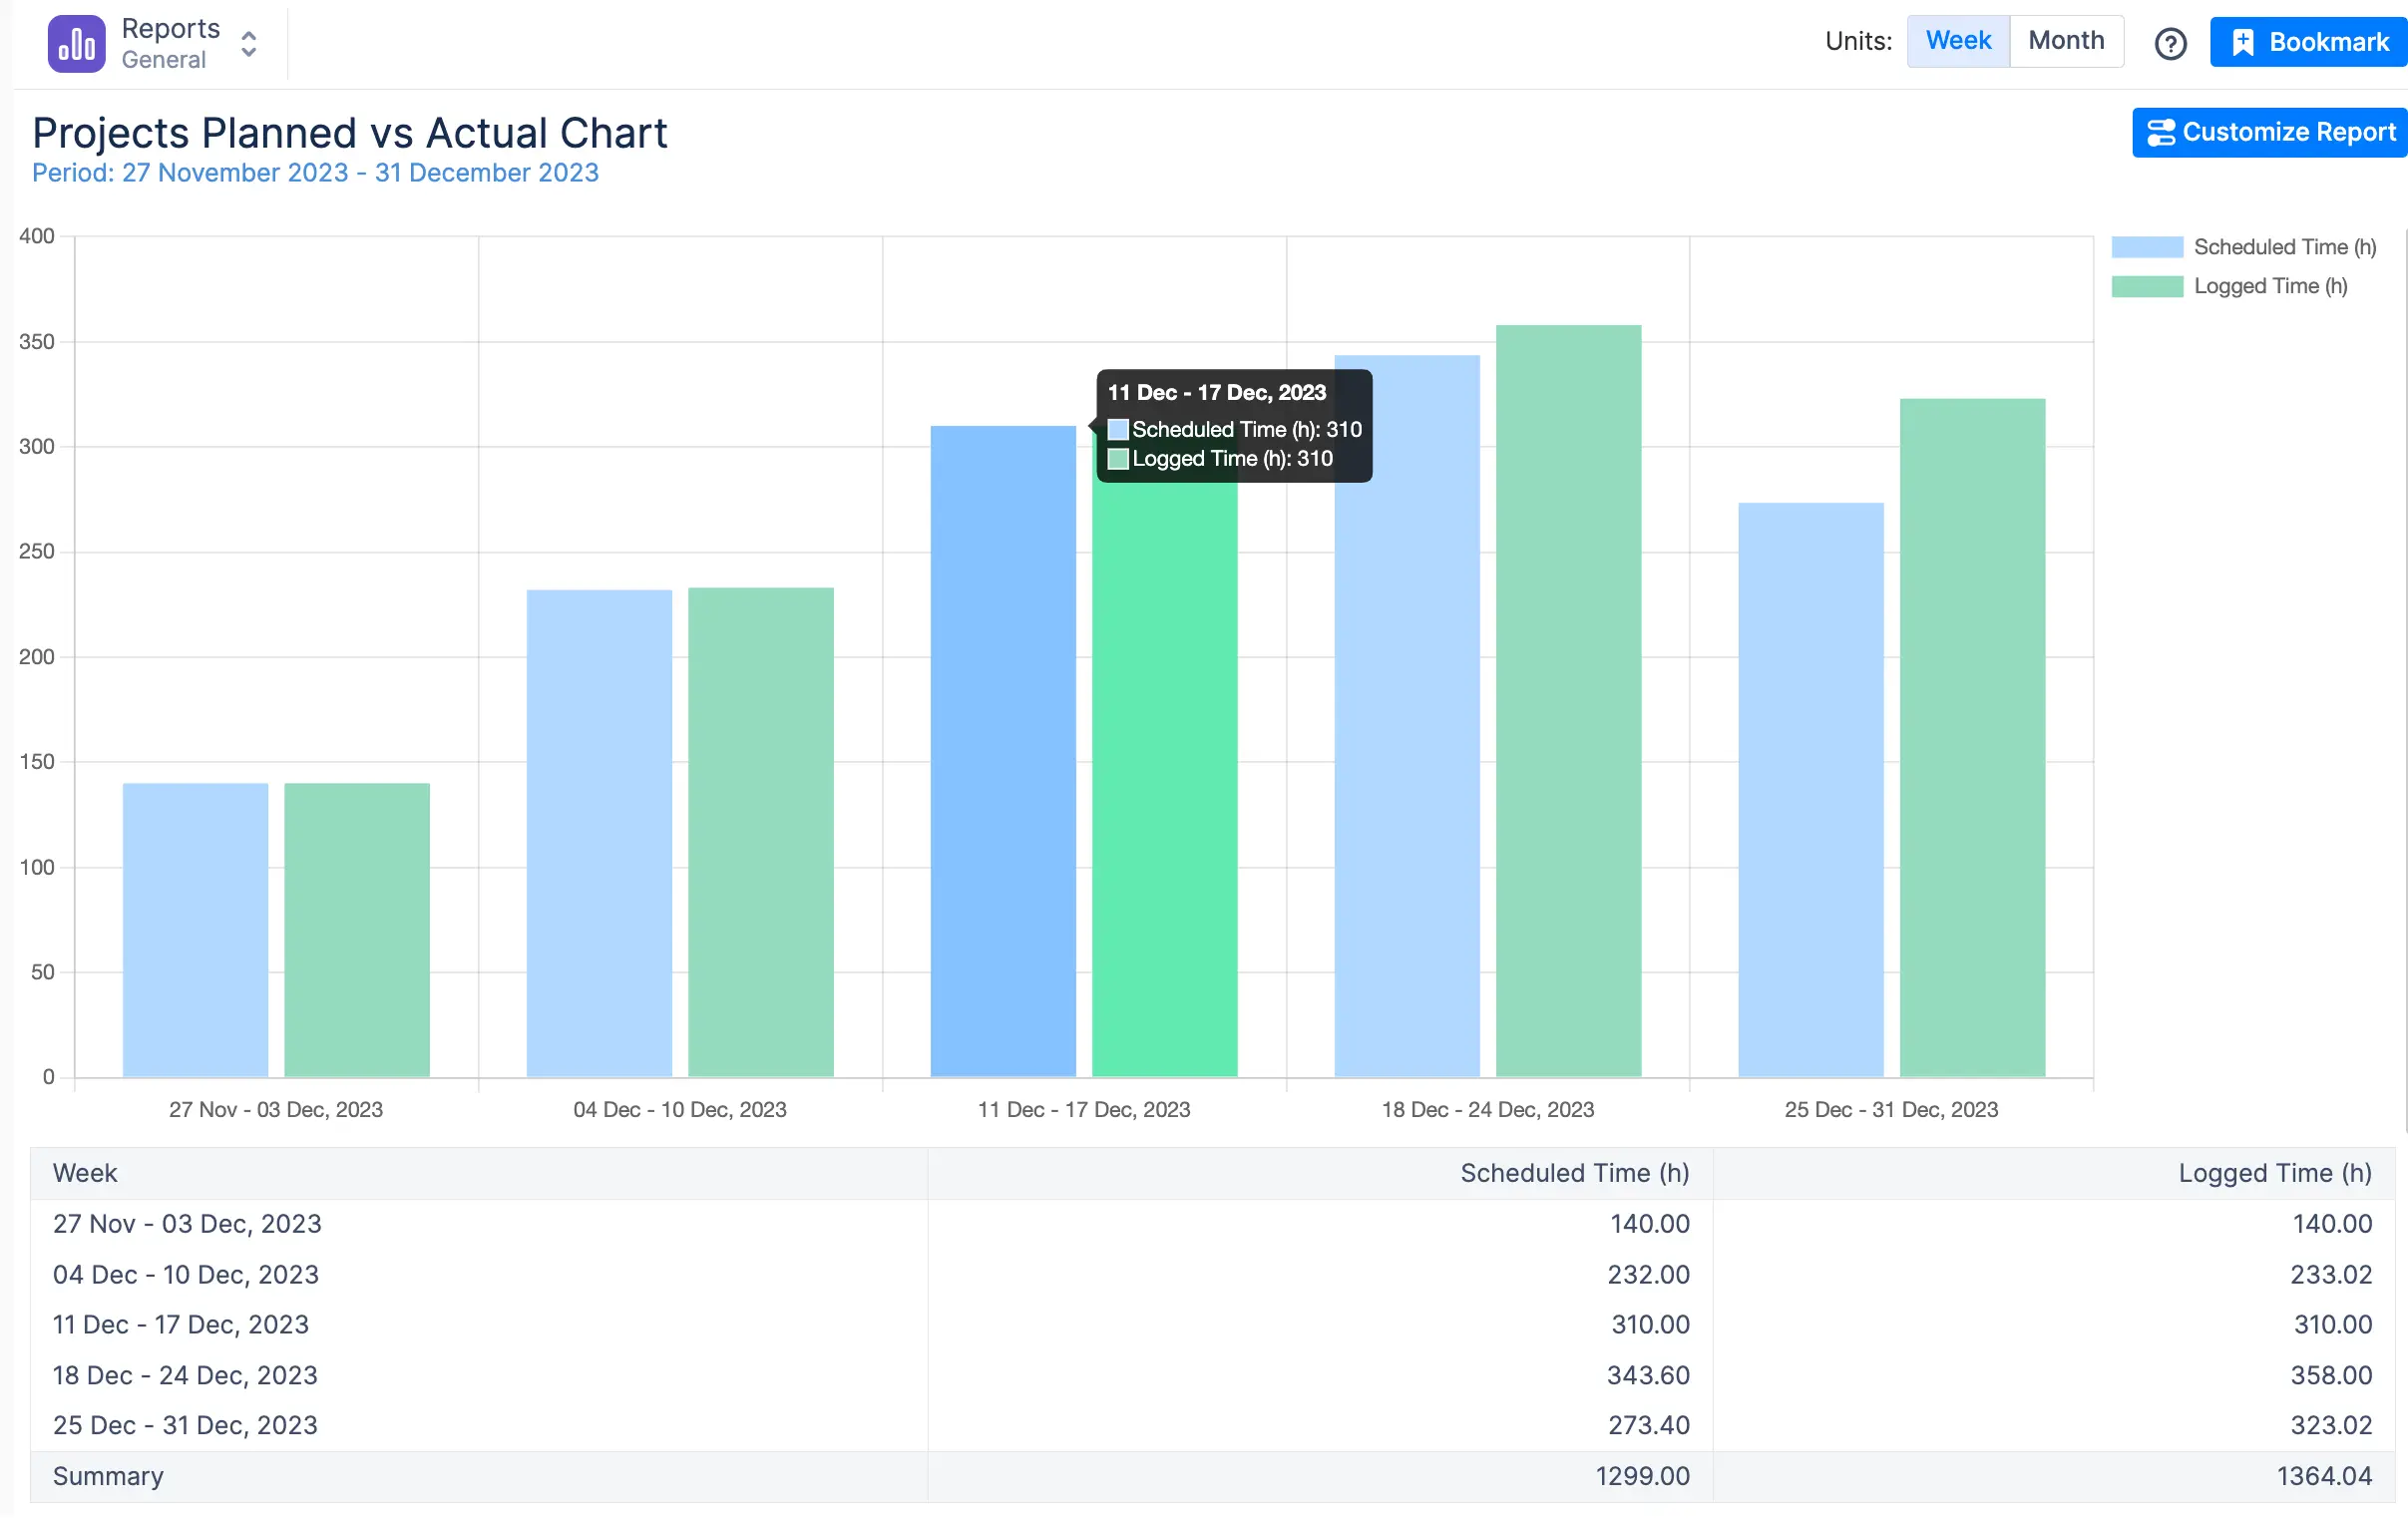
Key insights:
- Team Capacity – See if your team has the bandwidth to take on more or if they’re overloaded.
- Scheduled Time – Track how much work was planned across projects using Jira estimates, ActivityTimeline Bookings & Placeholders.
- Logged Time – Monitor actual hours worked via Jira’s Log Work feature.
If your team planned for 23 hours but logged 40, your estimates were way off. That’s a problem. This chart highlights these gaps so you can fix your resource planning before the next sprint.
- Report by Team, Project, or Epic – Zoom in on the data that matters.
- Filter by Timeframe – Choose a pre-set or custom reporting period.
- Compare Capacity vs. Workload – Balance team resources to keep projects on track.

6. Identify Risks and Roadblocks Early
Projects rarely go 100% according to plan. The trick is spotting issues before they spiral out of control. ActivityTimeline helps you track delays and their impact on deadlines so you can proactively manage risks instead of scrambling at the last minute.
How It Works:
- Monitor Workload Reports – Spot overloaded teams before burnout sets in.
- Compare Planned vs. Actual Work – Identify deviations early and adjust schedules.
- Use Risk Reports – Highlight bottlenecks before they derail your entire project.
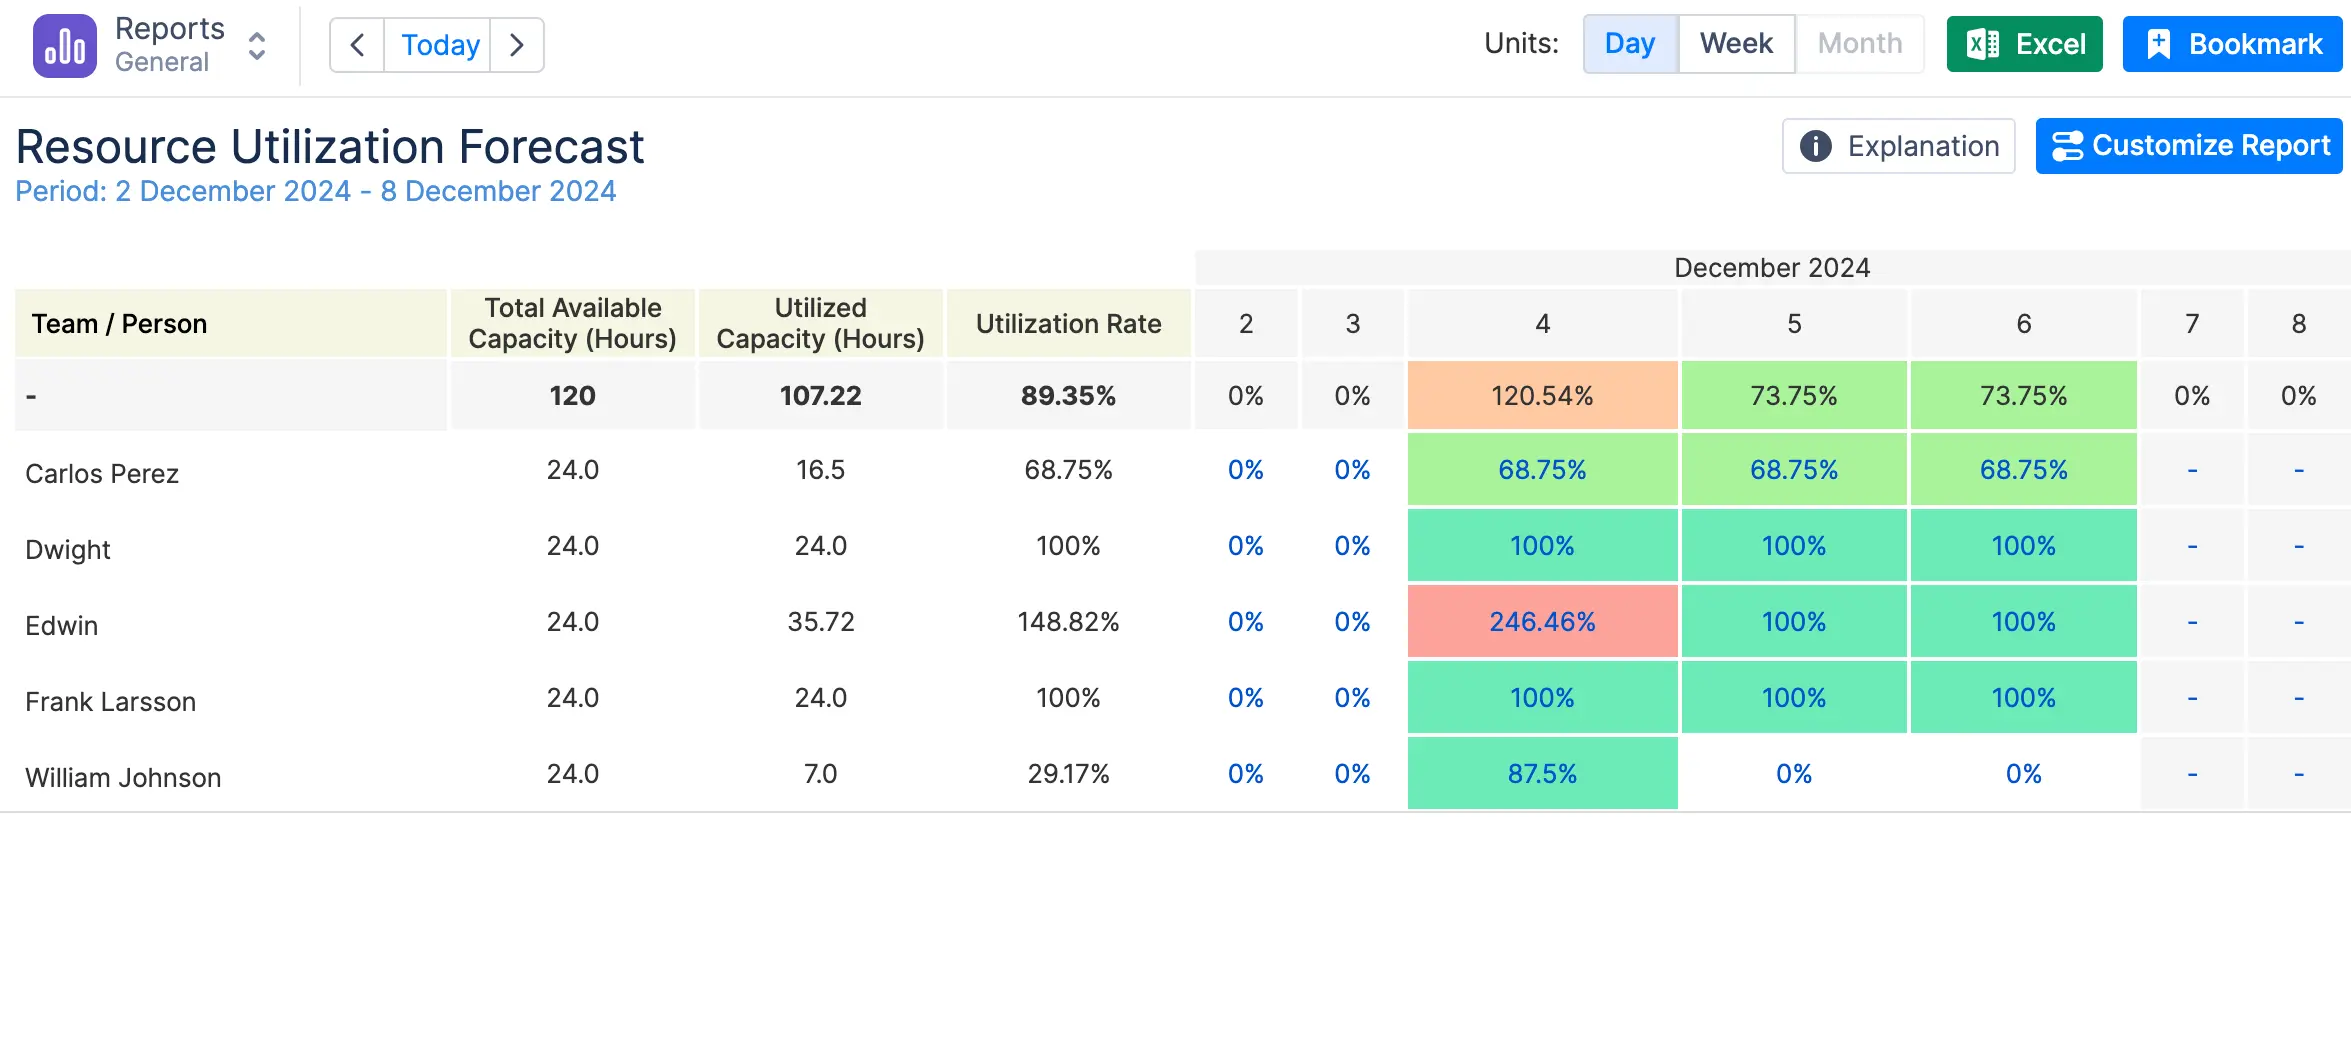
Seeing a trend of underestimated tasks? Flag it in your next risk review meeting. Noticing delays stacking up? Adjust priorities before they impact project milestones. The goal is to keep your team ahead of problems, not reacting to them.
7. Make Reports Actionable
Reports shouldn’t just sit in a folder. They should drive action. ActivityTimeline’s reports don’t just show project data—they tell you what needs fixing and who should fix it.
How to Turn Data Into Action:
- Highlight Key Takeaways – Focus on what matters: risks, progress, and resource allocation.
- Assign Ownership – Every insight should have a clear owner responsible for follow-ups.
- Set Next Steps – Don’t just report the problem—create a plan to solve it.
For example, if your Planned vs. Actual chart shows constant underestimation, don’t just acknowledge it—schedule a review of your estimation process. If workload reports show certain team members are overloaded, redistribute tasks before deadlines slip.
At the end of the day, reports aren’t just about tracking project progress. They’re about making sure your project successfully hits its goals. Keep them focused, make them actionable, and ensure your team always stays on the same page.
8. Automate Reporting Where Possible
Manual reporting is a time sink. It’s slow, error-prone, and a drain on resources. That’s where Jira automation comes in. ActivityTimeline takes the grunt work out of the reporting process by generating project progress reports, resource reports, and workload reports automatically. No more hunting for data across Jira—just real-time insights at your fingertips.
With built-in templates and customizable filters, you can create project management reports with just a few clicks. More than that, you can add these reports on your Jira dashboard and get a quick glimpse of everything you find necessary.
9. Ensure Real-Time Data Accuracy
A report is only as good as the data behind it. If your project data is outdated, so is your report—and that’s a problem for project stakeholders who need accurate information to make decisions.
ActivityTimeline keeps everything in sync with live Jira data. Whether you’re tracking project progress, checking project deadlines, or reviewing a resource report, you’re always working with the most up-to-date information. The two-way integration between Jira and ActivityTimeline ensures that any updates in one system reflect instantly in the other.
This means no more surprises—just accurate, real-time project metrics that help you stay ahead of delays and roadblocks.

10. Keep Reports Concise and Focused
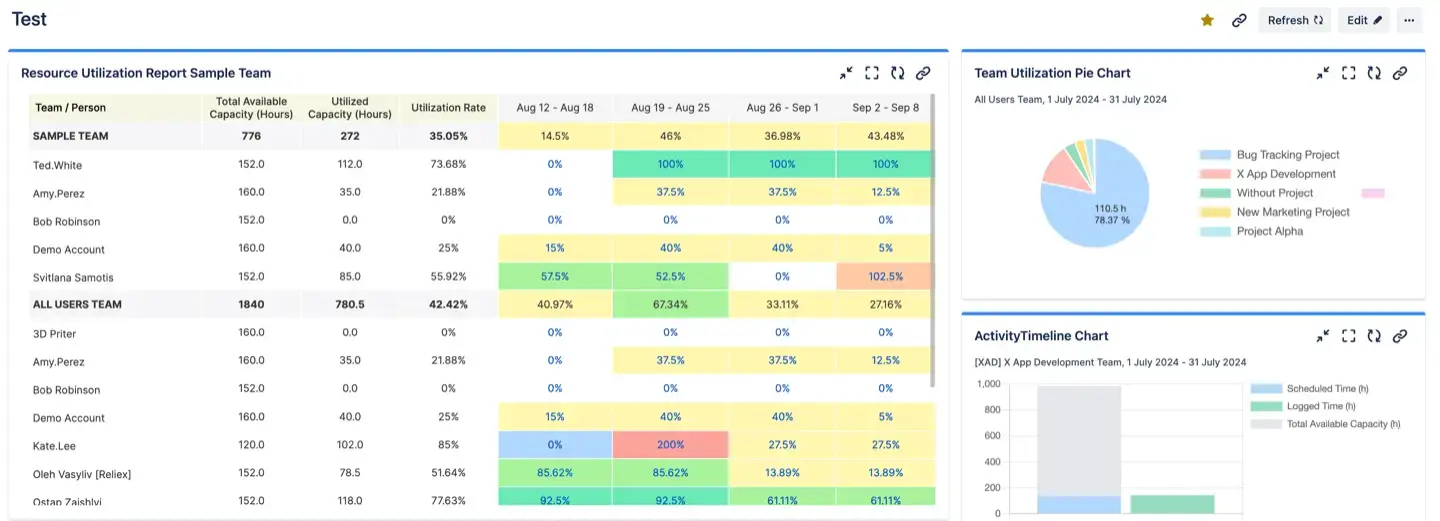
Nobody wants to read a novel-length status report. The best project reports cut through the noise and highlight only the most important data points. That’s why ActivityTimeline gives you clear, visual reports that summarize project timelines, team capacity, and key milestones at a glance.
Executives want quick takeaways. Project managers need actionable insights. Teams need clarity. Avoid information overload by focusing on the key elements that matter—whether it’s a budget report, a resource forecast, or a project’s timeline.
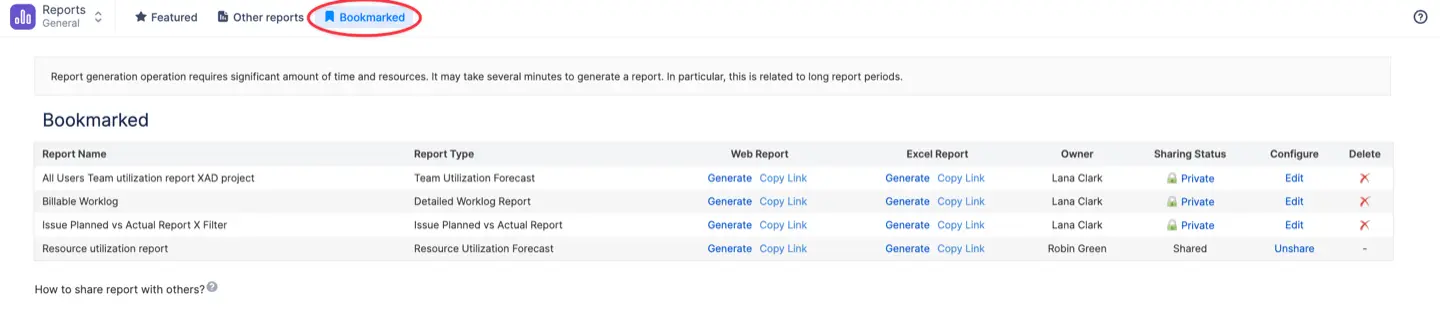
With ActivityTimeline’s bookmarked reports, you can save your most-used reports and access them instantly, keeping your reporting process streamlined and efficient.
Conclusion
Great project reporting isn’t just about collecting data—it’s about turning that data into actionable insights. By automating reports, ensuring real-time accuracy, and keeping things concise, you’ll create reports that actually drive decision-making.
ActivityTimeline makes this easier by bridging the gap between project planning and reporting. With powerful resource and capacity management features, seamless Jira integration, and a suite of advanced reports, it’s the project management tool that helps teams stay ahead.
Whether you’re tracking project scope, managing project risks, or optimizing your project workflow, ActivityTimeline ensures that you have the right data at the right time. Ready to make reporting smarter and more efficient? Dive in and see the difference for yourself!