En cualquier proyecto, el progreso es algo que debe rastrearse, entenderse y comunicarse.
Para los gerentes de proyectos, la elaboración de un informe de progreso es una oportunidad para contar la historia del proyecto en marcha: lo que se ha logrado, incluidos los logros clave relacionados con los hitos del proyecto, la situación actual y lo que queda por delante.
Sin embargo, a pesar de que Jira es una de las plataformas de gestión de proyectos más utilizadas, muchos usuarios siguen esforzándose por crear informes de progreso que sean claros, significativos y fáciles de aplicar. Jira es excelente para gestionar problemas y asignar tareas diarias. Sin embargo, cuando se trata de presentar el panorama general o de compartir un informe de progreso de una página con las partes interesadas, la plataforma no es suficiente. Visualización de Jira puede ayudar a mejorar informes personalizados y presentación.
Ahí es donde herramientas como ActivityTimeline entra, no para reemplazar a Jira, sino para convertir los datos sin procesar en actualizaciones estructuradas que mantengan a todos informados y alineados.

En esta guía, analizaremos los desafíos de crear informes de progreso en Jira y presentaremos ActivityTimeline, una potente aplicación que transforma los datos de Jira en plantillas de informes de progreso visuales y en tiempo real diseñadas para equipos ágiles y basados en el tiempo.
¿Qué es un informe de progreso en Jira y por qué es importante?
En Jira, un informe de progreso es una descripción general estructurada que registra cuánto trabajo se ha completado, cuánto queda por hacer y en qué medida la ejecución se alinea con el plan original. Por lo general, incluye:
- Porcentaje de finalización de los números
- Tiempo empleado en comparación con el tiempo estimado
- Desglose de las tareas en epopeyas, historias y subtareas
Un informe de progreso no es lo mismo que un informe de estado, aunque los dos suelen confundirse. Si bien un informe de estado puede centrarse en lo que está sucediendo actualmente, un informe de progreso completo ofrece una visión más completa: analiza las tareas completadas, destaca los hitos principales y proyecta lo que se espera en el futuro.
La redacción de informes de progreso es una parte fundamental de la gestión de proyectos moderna. Cuando se hacen correctamente, ellos:
- Ofrecer una visión general de alto nivel del estado del proyecto
- Mantenga actualizados a los equipos internos y a las partes interesadas externas
- Actuar como punto de referencia para el próximo informe de progreso
- Introduce información en el informe final y en el análisis posterior al proyecto
Sin embargo, en la práctica, muchos equipos siguen confiando en hojas de cálculo, cadenas de correo electrónico o herramientas desconectadas para preparar estos informes, lo que a menudo hace perder tiempo e introduce inconsistencias que dificultan la presentación de los objetivos más amplios de un proyecto y mantienen informadas a las partes interesadas.
¿Por qué importa? Un seguimiento claro del progreso conduce a:
- Planificación más inteligente. Saber el desempeño de su equipo le permite ajustar los planes futuros de manera más realista.
- Alineación de partes. Los informes transparentes mantienen a todos informados, lo que reduce las sorpresas.
- Mitigación de riesgos. La identificación temprana de los retrasos permite intervenir y corregir el rumbo a tiempo.
Los desafíos de la presentación de informes de progreso en Jira sin una herramienta específica
Jira se diseñó como un rastreador de problemas. Funciona de maravilla cuando quieres asignar tareas, documentar errores o planificar sprints. De fábrica, Jira no ofrece una manera fácil de generar informes de progreso estructurados y de varios niveles. Los usuarios suelen enfrentarse a:
- Recopilación manual de datos. La agregación de información de epopeyas, historias y subtareas lleva mucho tiempo.
- Formatos inconsistentes. No existe una vista estándar, lo que dificulta la comparación de los datos entre los equipos.
- Seguimiento por tiempo limitado. El seguimiento del tiempo incorporado es básico, con pocas opciones para visualizar o analizar el tiempo empleado.
- Poca visibilidad en todas las jerarquías. El progreso en el nivel Epic no refleja automáticamente el estado de los problemas infantiles.
El resultado es una falta de claridad y una pérdida de tiempo compilando informes que no cuentan la historia completa.
Los datos están ahí, pero ¿incluirlos en una plantilla de informe de progreso coherente que refleje la jerarquía, el seguimiento del tiempo y el esfuerzo en un proyecto en particular? Eso requiere un esfuerzo manual. Para los directores de proyectos que trabajan con plazos ajustados, se trata de una complejidad innecesaria.
Puede obtener una lista de entradas abiertas o cerradas. Pero, ¿qué pasa con la relación entre las epopeyas, las historias y las subtareas? ¿Qué tal un resumen visual de lo que se ha planificado en comparación con lo que realmente se ha llevado a cabo? ¿Qué tal ver cómo se comparan las estimaciones de tiempo con el tiempo real registrado?
Esta brecha a menudo conduce a informes mal estructurados que no brindan la claridad que esperan las partes interesadas.

Cómo te ayuda ActivityTimeline a contar la historia correcta
ActivityTimeline se creó para cerrar esta brecha, no solo para crear informes, sino también para crear herramientas de comunicación que ayuden a los equipos de proyecto a articular el progreso con claridad.
#1. Visualice el progreso con informes jerárquicos de progreso del proyecto
Empieza con la estructura. ActivityTimeline presenta una vista de árbol dinámica que muestra claramente las jerarquías de los proyectos, desde epopeyas, proyectos e iniciativas hasta historias y subtareas. La plataforma lee tus datos de Jira y los presenta en un formato visual y jerárquico. En lugar de tareas aisladas, verás cómo las historias se conectan con las epopeyas y cómo la finalización de las subtareas contribuye al progreso general. Esto es fundamental si quieres reflejar el plan del proyecto y su alineación con hitos del proyecto.

Esta estructura visual le permite:
- Vea al instante cómo el progreso de los problemas de los niños afecta a las tareas de los padres
- Ver información clave como Cesionario, fecha de vencimiento, estado, tiempo empleado y estimación restante
- Personalice la jerarquía para que se adapte a sus necesidades
📌 Caso de uso: Un director de proyecto puede identificar rápidamente los obstáculos (como una historia incompleta que frena el progreso de una epopeya) sin tener que analizar manualmente cada número.
#2. Elija su propio método de cálculo del progreso
Y lo que es igual de importante, ActivityTimeline te da flexibilidad a la hora de calcular el progreso. Según tu público y tus objetivos, puedes centrarte en el número de números finalizados o compararlos tiempo empleado en comparación con las estimaciones originales para medir el rendimiento.
ActivityTimeline ofrece dos métodos de cálculo flexibles:
- Por números finalizados: Ideal para equipos ágiles centrados en el cierre de tareas.
- Por tiempo registrado frente a estimaciones: Útil para equipos basados en el tiempo que necesitan información sobre el esfuerzo y la eficiencia.
📌 Ejemplo real: Un equipo que prepara un informe para la alta dirección pasa del cálculo basado en problemas al cálculo basado en el tiempo para demostrar la asignación de recursos con mayor claridad.
#3. Crea informes basados en proyectos, epopeyas o filtros
No es necesario que todos los informes lo muestren todo. ActivityTimeline le permite:
- Generar informes para proyectos completos de Jira, epopeyas específicas, o filtros Jira personalizados
- Filtrar por equipos, fases o iniciativas
- Personalice quién ve qué para obtener mejores informes internos o específicos para las partes interesadas

📌 Beneficio: Informes más relevantes y concisos que cuentan la historia correcta a la audiencia adecuada.
#4. Genere y perfeccione informes en tiempo real
Tras seleccionar los criterios, genere su informe haciendo clic en Personalice el informe botón en la esquina superior derecha. A continuación, puede:
- Oculta las tareas «finalizadas» para reducir el desorden
- Cambiar entre los métodos de cálculo del progreso
- Añadir o eliminar campos sobre la marcha

También es posible para ocultar los problemas «terminados» o secundarios del informe, pero se seguirán incluyendo en el cálculo del informe:

Informe planificado frente a informe real: mida la precisión de las estimaciones y la eficiencia del equipo
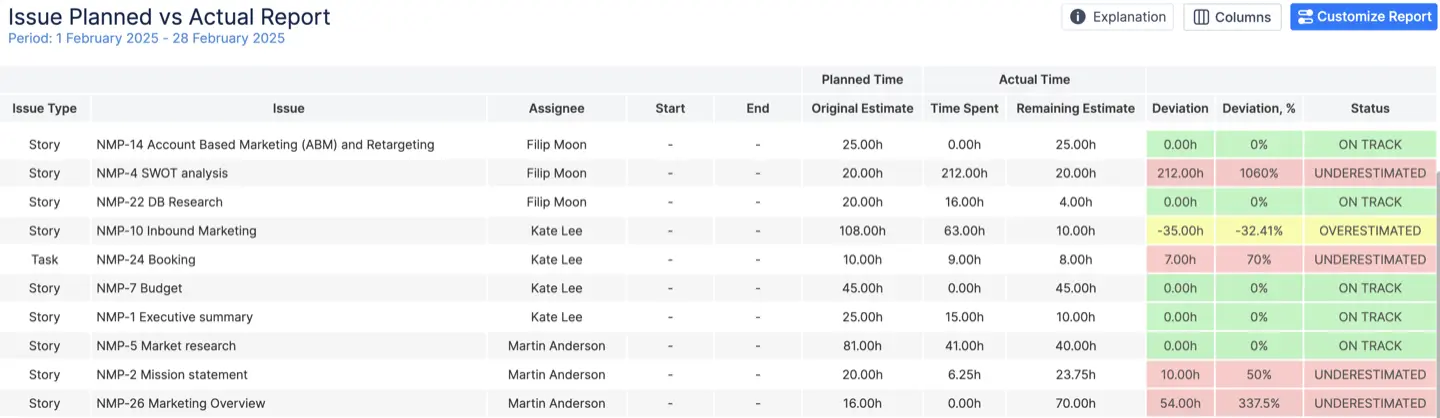
Para los proyectos que dependen en gran medida de la gestión del tiempo y los recursos, el Informe planificado frente a informe real en ActivityTimeline cambia las reglas del juego. Compara el tiempo esperado (según las estimaciones originales) con las horas reales registradas, lo que ofrece una visión realista de cómo se desarrollan los cronogramas de tu proyecto.
#1. Compare las estimaciones originales con el tiempo real registrado
ActivityTimeline Informe planificado frente a informe real le ayuda a comprobar si sus estimaciones iniciales eran precisas:
- Comparar Tiempo planificado (estimación original) con Hora actual (registrado + restante)
- Identifique las tareas que se ejecutan de manera constante a lo largo del tiempo
Puede incluir el tiempo de las subtareas en las tareas principales para asegurarse de que el informe capture todo el alcance del trabajo, incluido el tiempo dedicado a las subtareas, y lo incorpore a los cálculos de tiempo de la tarea principal.
Este informe es muy útil para supervisar el rendimiento de los proyectos, hacer un seguimiento de la eficiencia del equipo e identificar las tareas o los proyectos que se subestimaron o sobreestimaron, lo que ayuda a refinar los procesos futuros de planificación y estimación de los tickets de JIRA, las estimaciones de tiempo (originales y restantes), el tiempo ya dedicado a los tickets y el estado de los tickets.
📌 Caso de uso: Identifique pronto los patrones de subestimación para poder volver a evaluar las prácticas de estimación.
#2. Indicadores visuales del estado de desviación
Los estados codificados por colores facilitan el escaneo y la comprensión:
- 🟢 En camino: El tiempo real coincide con la estimación planificada
- 🔴 Subestimado: Se necesitó más tiempo del previsto
- 🟡 Sobreestimado: Se necesitó menos tiempo
📌 Gestión inteligente de riesgos: Los gerentes pueden intervenir antes de que las pequeñas demoras se conviertan en problemas importantes.
#3. Información estratégica sobre la capacidad del equipo y el uso de los recursos
Utilizado estratégicamente, este informe ayuda a los gerentes de proyectos a ver dónde las cosas pueden desviarse antes de que sea demasiado tarde. Fomenta conversaciones más profundas, no solo sobre las tareas que llevaron demasiado tiempo, sino también sobre los desafíos enfrentados, por qué se produjeron las demoras y cómo puede mejorar la planificación futura. Usa esta información para:
- Prevenga el agotamiento al ver dónde están sobrecargados los equipos
- Evite la infrautilización mediante la reasignación de los recursos disponibles
- Mejore la planificación y la previsión de los sprints futuros
Para generar un informe, debe configurar los parámetros, como el período, los equipos, los proyectos, agrupar por, etc. Por ejemplo, si selecciona Agrupar por Sprint, se mostrará una fila de resumen con una descripción general del estado general del sprint.

Una vez generado el informe, puede refinarlo y ajustarlo de forma dinámica haciendo clic en Personalice el informe botón en la esquina superior derecha.

Por último, Gráfico planificado frente a gráfico real ofrece una visión general detallada del desempeño de un equipo durante un período de tiempo específico. Está diseñado para capacitar a los líderes y gerentes de equipo con la capacidad de comparar la capacidad del equipo con el trabajo planificado y el trabajo que finalmente se entregó.
Esto es lo que hace:
- Capacidad del equipo (solo cuando el equipo informa): Esto representa la carga de trabajo máxima que un equipo puede gestionar durante el período seleccionado. Se basa en capacidades combinadas de todos los miembros del equipo.
- Hora programada: Esto representa la cantidad de trabajo que se programó para el equipo en varios proyectos. Esto se basa en la estimación original de los números de Jira, el calendario de actividades, las reservas y los marcadores de posición.
- Tiempo registrado: Muestra las horas realmente trabajadas por el equipo y ofrece una imagen real de los resultados del equipo en función del tiempo enviado a través del diálogo Log Work (ya sea en Jira o en ActivityTimeline).

Mejores prácticas para escribir informes de progreso con ActivityTimeline
Uno de los beneficios ignorados de crear informes más inteligentes es que ahorra tiempo, tanto para la persona que escribe el informe como para las personas que lo leen. Un informe bien estructurado de una página con un resumen ejecutivo claro permite a los responsables de la toma de decisiones absorber rápidamente la información actual y proporciona valiosos comentarios. También se convierte en un documento dinámico que los equipos pueden consultar en retrospectivas o revisiones semanales.
Además, dado que ActivityTimeline se integra directamente con Jira, el proceso de elaboración de informes pasa a formar parte de tu flujo de trabajo.
- Utilice el informe de progreso del proyecto como base
Comience con una visión clara de la jerarquía del proyecto y del progreso actual. - Añada el Informe planificado frente a informe real como control de calidad
Utilízala para verificar si tu equipo está entregando a tiempo y dentro de las estimaciones. - Personaliza campos y filtros
Personalice los informes para las partes interesadas: los ejecutivos pueden querer una visión de alto nivel, mientras que los líderes de equipo pueden preferir datos granulares. - Guardar y reutilizar plantillas de informes
Reduzca el trabajo repetitivo mediante la creación de plantillas para informes semanales, quincenales o mensuales. - Comparta y exporte informes fácilmente
Los informes se pueden exportar o compartir directamente desde ActivityTimeline para que lleguen a las partes interesadas de dentro o fuera de Jira. Simplemente utilizas los datos que ya existen, pero los presentas de forma estructurada, visual y comunicativa.

Conclusión
Los mejores informes no solo dicen «Esto es lo que hicimos». Dicen: Así es como avanzamos hacia nuestras metas. Esto es lo que hemos aprendido. Y esto es lo que haremos a continuación.
Eso es lo que hace que los informes de progreso sean importantes en todas las organizaciones que valoran la claridad, la transparencia y la mejora continua. Se trata de presentar el progreso de una manera que inspire confianza, invite a la colaboración y capacite al equipo para seguir avanzando hacia el futuro. Con el software de gestión de proyectos adecuado y un enfoque cuidadoso de la elaboración de informes que se alinee con tus objetivos, puedes convertir cada actualización en un importante paso adelante.