As a project manager or department head, you likely encounter an overwhelming volume of data daily. You have raw numbers like hours logged, tasks assigned, and deadlines looming. But extracting meaningful insights can feel impossible. This is a common pain point for professionals who need custom grouping in reports to transform informational chaos into strategic clarity.
Without the ability to categorize and slice your data effectively, you risk missing critical organizational trends. Is one department consistently overloaded while another remains underutilized? Are specific client cost centers draining your budget without proportional output? Data without structure is merely noise; only through proper grouping can you understand its true nature and make informed business decisions.
In this article, we will explore the theoretical importance of data structuring and how Jira Group By feature empowers you to manage projects with precision.
Why is Unstructured Data the Enemy of Effective Management?
Jira is an exceptional platform for tracking individual issues and granular task details. However, its native reporting often provides a "flat" view that fails when you require a high-level strategic perspective. You might see a list of tasks for a specific user, but you cannot easily aggregate that data by "Department," "Cost Center," or "Client".
The lack of flexible grouping options often leads to several management failure points:
- Analysis Paralysis: Managers spend hours exporting flat data to external spreadsheets just to create pivot tables for basic reporting.
- Invisible Bottlenecks: Capacity issues remain hidden because data is scattered across hundreds of rows rather than summarized by team skill or role.
- The "Unassigned" Void: Items without values in standard fields are often grouped into generic categories like "No Epic," making incomplete tasks harder to spot.
- Reactive Decision-Making: Resource decisions are made based on fragmented information, leading to team burnout and missed project milestones.
When you cannot organize data according to your unique business hierarchy, you are managing reactively rather than proactively.
The Power of Context: Transforming Noise into Insight
Proper data grouping is the process of aggregating information into meaningful categories to reveal hidden patterns. In a management context, this means moving beyond "what" is happening to "why" and "where" it is happening. Using Jira Group By filed in reports you get the context necessary for your data to become a strategic asset.
ActivityTimeline transforms the Jira experience by introducing advanced custom grouping features. This capability allows you to restructure how data is displayed across the entire application, using any standard or custom Jira field.
This feature is available across three key modules, ensuring you have structured insights at every stage of your management workflow.
1. Reports (Analytics)
This is the primary engine for your strategic decision-making. To add a grouping option to a report, take the action of selecting fields such as 'assignee', 'labels', or 'components' from the grouping dropdown. Dashboard gadgets, such as the Pie Chart Gadget and the Status & Progress Report gadget, can be used to visualize grouped report data, displaying issue distribution by Status, Assignee, or Priority.
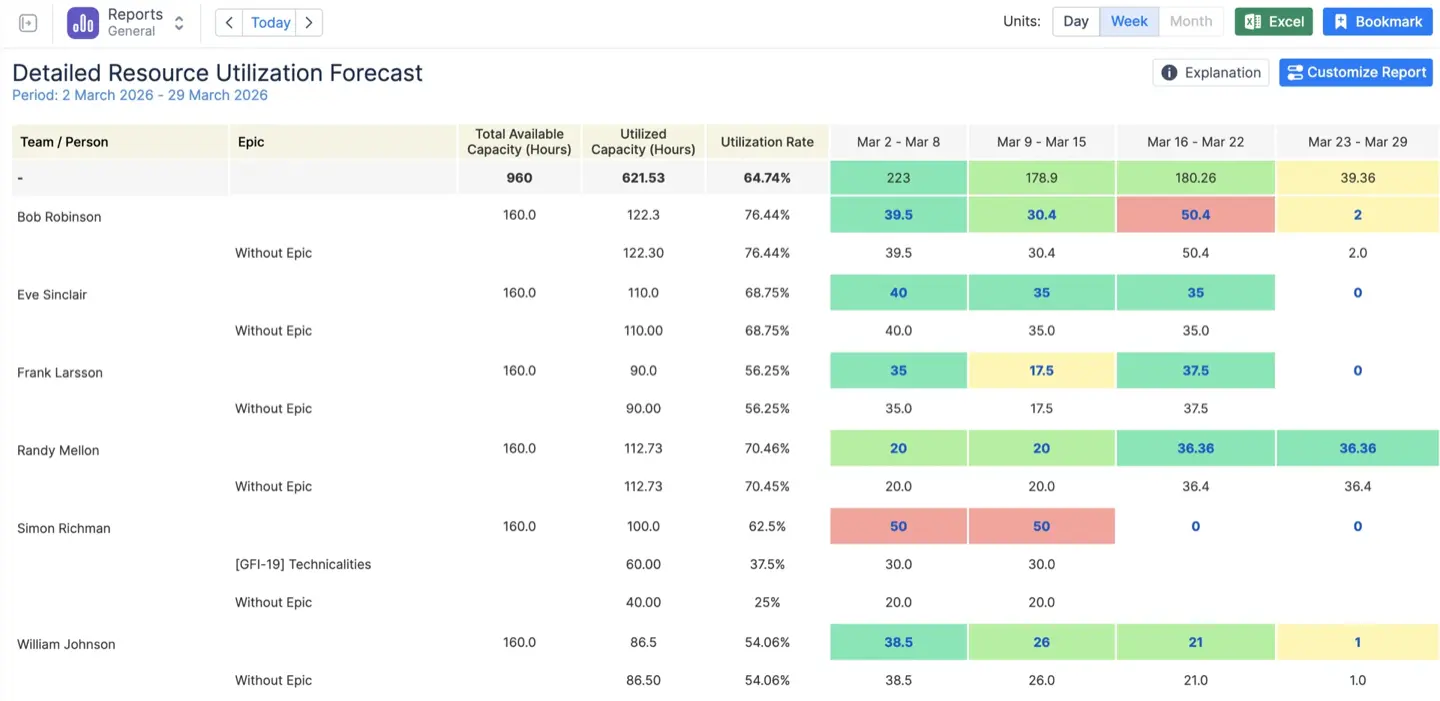
You can group forecasting and project reports to analyze capacity or progress from different angles. For instance, you can view “Planned vs Actual grouped by Epic” to see which major initiatives are consuming the most resources, or group by Sprint to see a summary providing an overview of the sprint’s overall status.
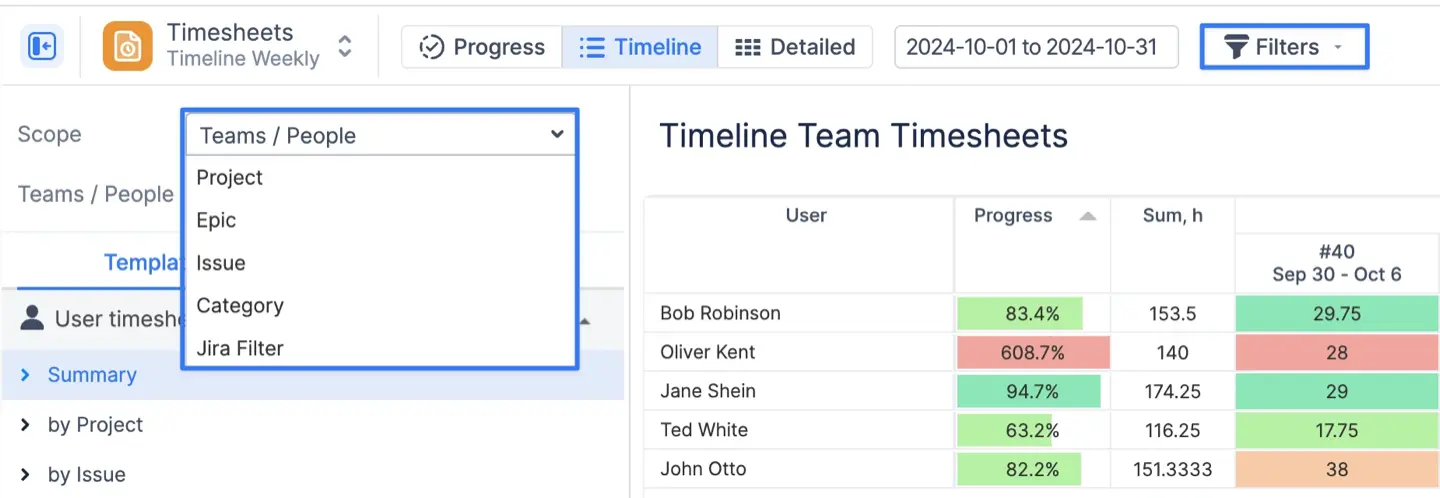
2. Timesheets (Track)
Tracking time requires granular detail, but you also need big-picture summaries. In the Timeline and Detailed timesheet views, you can group worklogs to see totals per specific category. You can group timesheet data by assignee, labels, or components to analyze worklogs from different perspectives, such as by assigned user, project area, or custom tags. A common case is grouping to distinguish between billable work, internal meetings, and training.
3. Planner (Issue Panel)
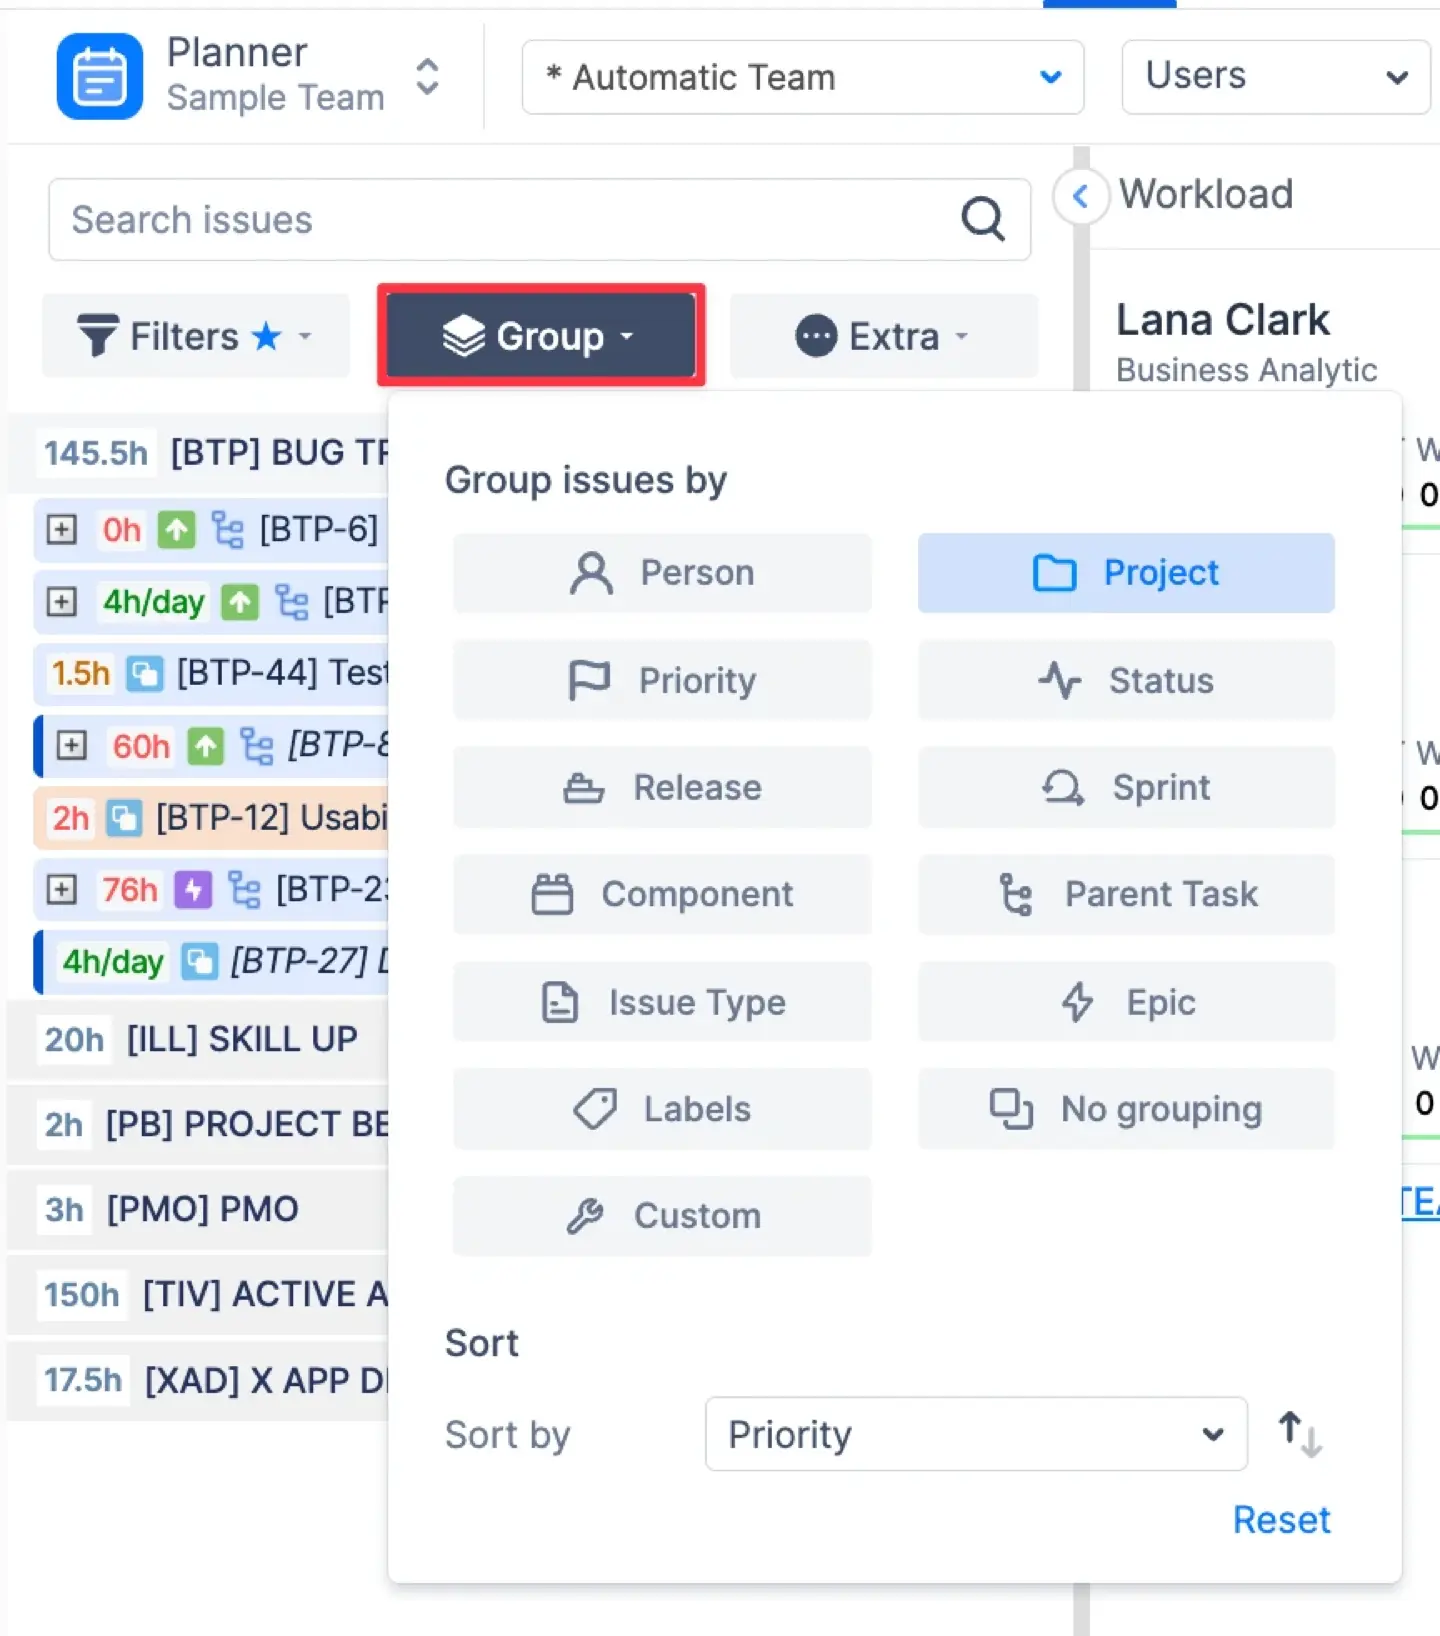
Even your backlog management benefits from this flexibility. You can group the backlog of unscheduled tasks by custom fields to locate work items more efficiently. For example, you might “Group issues by Priority or Component” to ensure your team tackles the most critical technical debt first. Additionally, you can group backlog items by assignee, labels, or components to prioritize and manage tasks more effectively.
Achieving Meaningful Data Grouping
Jira Group By involves a structured approach to data refinement. ActivityTimeline has unified this workflow to make the transition from noise to insight intuitive.
#1. Establishing Core Parameters
Effective grouping begins with defining the scope of your inquiry. You must first select the appropriate timeframe and the specific teams or resources you wish to analyze. Without these boundaries, even grouped data can become overwhelming.
#2. Selecting the Grouping Hierarchy
The choice of grouping field determines the "story" the report tells. A report grouped by "Epic" tells a story of project progress; a report grouped by "Client" tells a story of business profitability. ActivityTimeline allows you to choose from standard Jira hierarchies or any specific custom field that matches your internal business structure.
#3. Dynamic Refinement
Grouping is not a static one-time action. After generating a report, you may need to refine the view by toggling percentages, adjusting filters, or hiding completed tasks to reduce visual clutter. This iterative process allows you to drill down into specific data points to uncover the root cause of project delays or capacity gaps.
Key Reports Enhanced by Advanced Grouping
To maximize the value of Jira Group By, focus on these high-impact reporting templates within ActivityTimeline.
- Resource Utilization Forecast. Group by Issue, Project, Epic, Assignee, Labels, Components, or Custom Field to visualize future workload distribution and gain insights by assigned users, categories, or project segments.
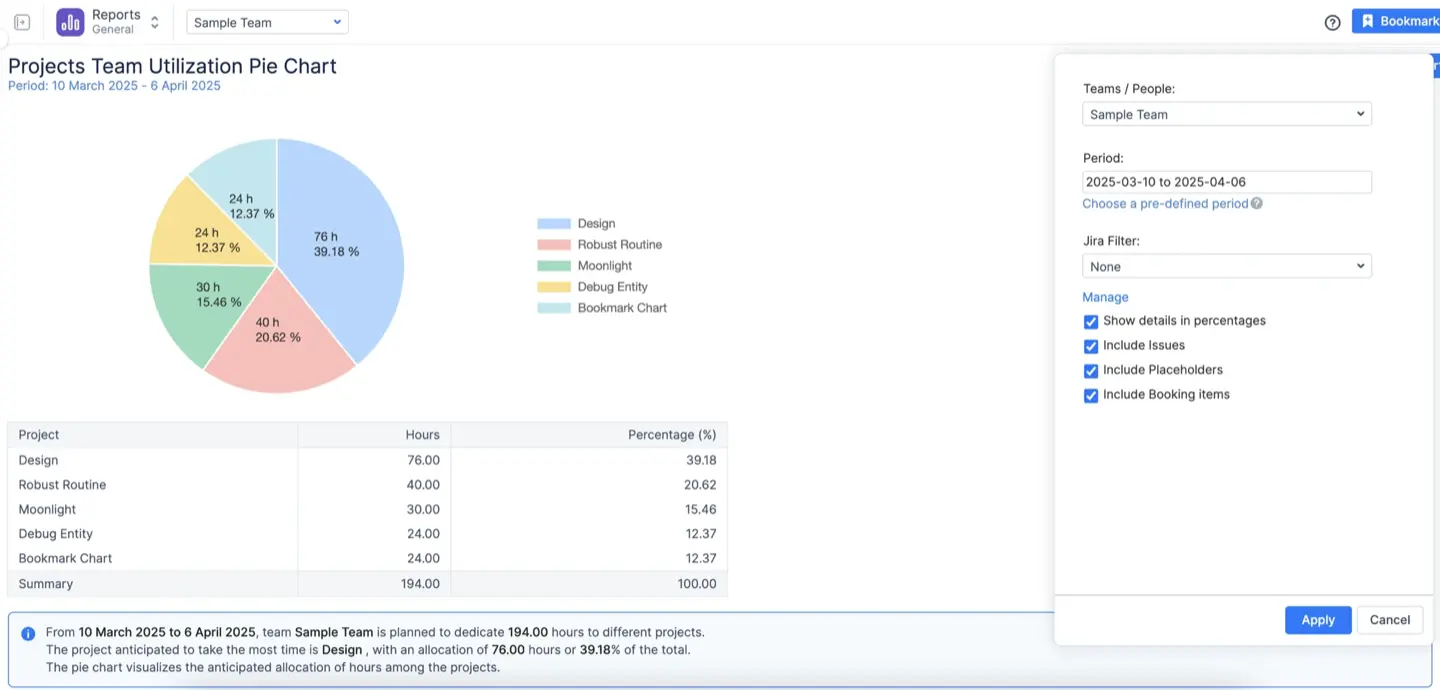
- Team Utilization Pie Chart. Group past or future data by custom fields like “Billable Status”, Assignee, Labels, or Components for a quick visual summary and to analyze work by team member, tag, or project part.
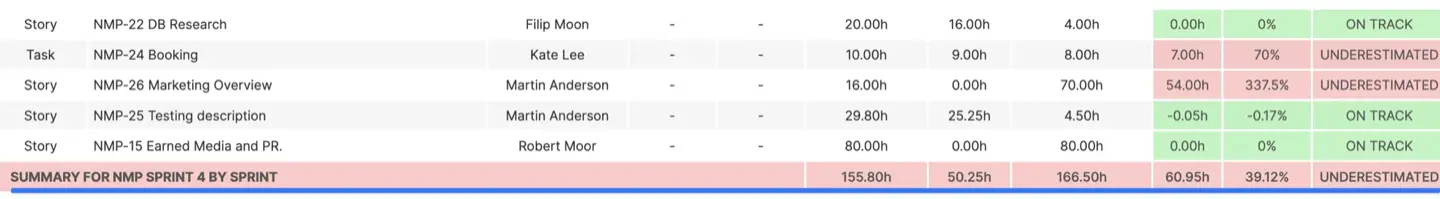
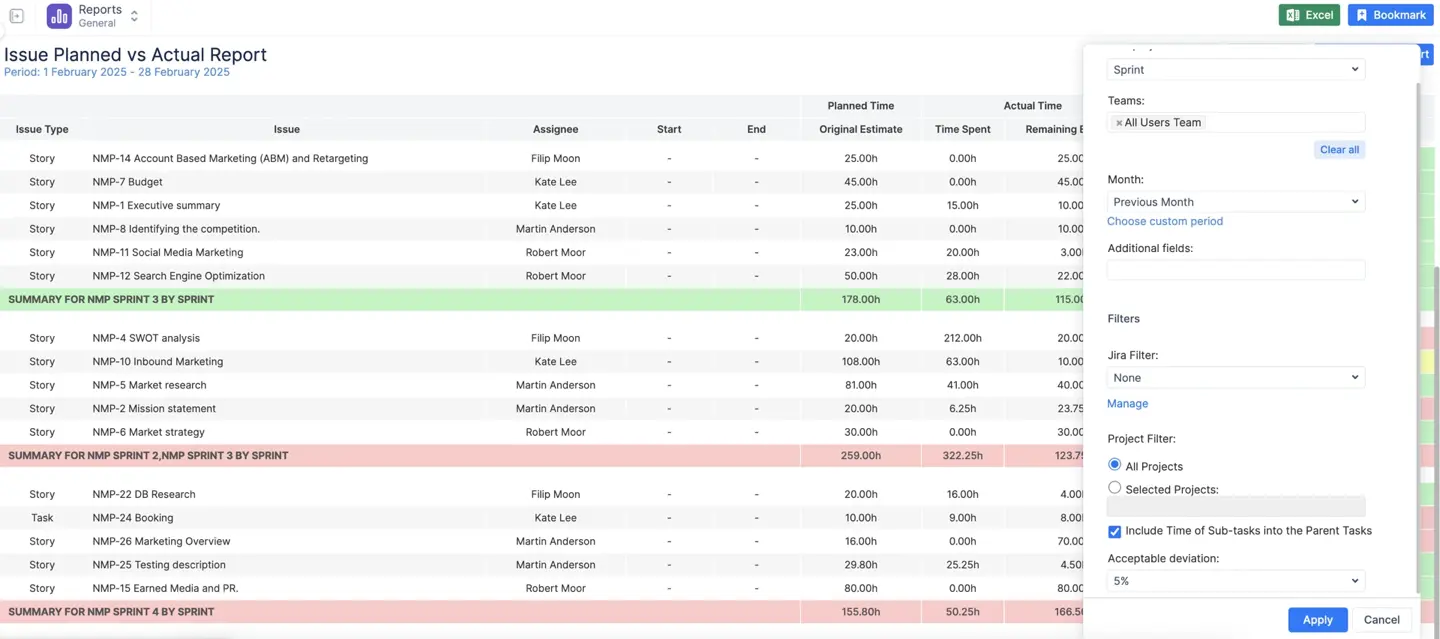
- Planned vs Actual. Group by Epic, Component, Assignee, or Labels to compare estimates against reality at a macro level, or to see performance by user or category.
- Detailed Worklog Report. Perfect for billing, allowing you to group line items by Client, Project, Assignee, Labels, or Components for detailed analysis and reporting.
Pro Tip: Once you have configured the perfect report with your specific grouping, use the Bookmark Report feature. This saves the configuration for one-click access later, saving you time on recurring reporting tasks.
Conclusion
Data without structure is a liability, but data with context is an asset. By utilizing Jira Group By: Custom Grouping in Reports within ActivityTimeline, you move beyond simple lists to sophisticated, hierarchical analysis. Whether you are tracking billable hours by client, monitoring capacity by skill, or analyzing project progress by Epic, custom grouping gives you the precision you need to manage effectively.
Stop wrestling with spreadsheets and start making data-driven decisions today.
{{rich-cta-1}}